Bad politics and bad management in the NHS

“To be clear,” wrote Richard Murray and Siva Anandaciva last year in the Health Service Journal (The Wretchedness of NHS Financial Planning, July 2023 [£]), “this is not fraud.” Richard was then Chief Executive of the King’s Fund, one of the country’s leading health think tanks, and Siva the Chief Analyst. 

When two of the country’s leading experts on the NHS have to clarify that what they are saying does not constitute an allegation of fraud against NHS finance directors up and down the country, we should take it as an indication that something is amiss.

Their article (which sadly is behind a paywall) describes how unrealistic demands are routinely made of NHS systems and providers, which are expected to deliver large and unspecified “efficiencies” without compromising the health care services they provide. It quotes a former local authority finance director who, on moving into the NHS, described “almost a mass collusion that doing ‘more with less’ was possible on this grand a scale.”

For the most part, NHS organisations play along with this for fear of being the first to step out of line and give NHS England the “wrong answer.” Occasionally though, one breaks cover. Another Health Service Journal article from last year [£] quoted leaders of a health system in Yorkshire openly admitting that they had changed their financial plans to say that they would break even as part of the “tactics of engaging with NHS England.” To be clear, however, this is not fraud.

Politics with different sizes of “p”

The NHS may well be the most politicised health system in the world. In a June 2022 edition of Radio 4’s The Briefing Room (18:24 onwards), Mark Pearson of the OECD identifies this as the main reason why the NHS seems to be struggling more than some other, similarly structured health systems. Politically-driven tinkering means that successive health secretaries introduce new reforms before the dust has settled on the last round. We never let anything play out and never learn what works.

Another consequence of this extreme politicisation is that unrealistic have-your-cake-and-eat-it demands come from the top. Ministers find it convenient to claim – and easy to get away with claiming – that the NHS can do more with less. Prevention, better integration of services, technology or unspecified “reform” are the balancing figure between what we want the NHS to be and the amount of money that the government is willing to spend. The problem is that prevention doesn’t save money and, despite years of trying, the NHS has still not found a replicable model of “integrated care” that delivers efficiencies. According to the Office for Budget Responsibility, in health care, “unlike most industries, technological innovations are generally cost-escalating rather than cost-containing.”

This cakeism permeates through the system. NHS England demands that health care systems and providers submit balanced financial plans, which say they will keep costs within their funding allocations. Alongside this, they are expected to manage changes in local demand for services and deliver on a range of centrally-determined priorities. The internal politics of the NHS mean that many finance directors decide that it’s better to submit a balanced plan that you are never going to stick to than be honest from the outset. NHS England knows exactly what is going on but finds it politically convenient to play along rather than call out unrealistic plans.

These politically-motivated fictions have a big impact on how the NHS is run. To understand why, we need to think about how complex systems work.

Unviable systems

In the 1980s, Stafford Beer developed the Viable System Model[1]. Starting from fundamental principles about managing complexity, the model describes how different layers of a system interact, the elements that need to be in place, and how information should be shared. If we can get our organisations working like this, they should be able to deal with complex stuff – like the health needs of a population – while being resilient to change and uncertainty.

In the model, the relationship between two layers of a system – say, between the senior management of an organisation and one of its operational divisions, or between health care commissioners and providers in one part of the country – is defined by the “resource bargain”. This describes the resources that are allocated and what is expected to be delivered in return. For example, the orthopaedic department in a hospital will be given a budget and expected to carry out a certain number of hip replacements and knee surgeries. The resource bargain defines the accountability that each part of the system has to higher levels of management. It also defines the autonomy that the department has: it can make changes to how it operates as long as it is still delivering the agreed outputs and staying within its budget.

Resource bargains in the NHS are agreed every year through the financial and operational planning process. NHS England sets financial allocations for each Integrated Care System. Annual planning guidance is published, describing priorities for the year, and this sits alongside a menagerie of longer-term plans and policies, many of which are “mandatory”. Integrated Care Boards then commission services from NHS trusts and set up contracts that say how much money each organisation will get and what it will provide in return.

The problem is that at one end of this chain of resource bargains are the claims made by ministers and at the other end is reality. Each layer of the system can choose to play along with the convenient fiction of always doing more with less, but reality tends to be less compliant. This tension has to be held somewhere, whether that’s an NHS provider spending more that it said it would, or clinical services being unable to deliver agreed levels of performance with the staff they can afford.

The “wretchedness” of NHS financial planning described by Murray and Anandaciva means that the resource bargains that should define autonomy and accountability throughout the NHS are wretched. What’s more, everyone involved knows this. But to be clear, this is not fraud.

Bad management

There are at least three ways in which this undermines good management in the NHS.

The first is that they are a huge and costly distraction. Senior managers spend large amounts of time and money on plans that they know aren’t realistic and aren’t going to happen. A fictional “breakeven” plan will be developed at the start of a financial year. When reality refuses to play along, a “recovery plan” is developed, perhaps with the help of expensive management consultants. This is supported by an “ambitious efficiency programme” with wildly optimistic savings. Board-level directors and chief executives spend large amounts of time in meetings about this stuff, which they all know is nonsense. This is not only expensive, but it takes managers away from the real business of running the NHS.

Another issue is that, after a while, people stop listening. They know that at the start of every year a “balanced” plan will be agreed; that part way through they year there will be a crisis when spending goes off track; and that towards the end of the year some money will be found to make it good. A rational response to this is to treat it all as noise. So senior managers find not only that they are spending their time managing fictions rather than reality, but that no one takes their exhortations to save money very seriously anymore. The resource bargains cease to function as a unit of accountability and managers often fill the gap with fear and a generalised sense of pressure.

A third problem is that putting unrealistic expectations onto health care teams makes the experience of working for the NHS much worse. When teams are told they have to do more with less, when the political narrative is that they should be meeting the needs of the population but they don’t have the resources to do so, NHS staff are overworked and still feel like they are failing. This is one factor driving the NHS’s rolling workforce crisis.

Altogether these issues leave the NHS less well managed than it should be, less efficient than it could be, and a worse place to work.

A politicised health system needs better politics

To give the former health secretary Andrew Lansley his dues (I know, but bear with me) he did identify this problem when he said we needed to take politics out of the NHS. Unfortunately, it is much easier to point at a problem than it is to solve it, and his solution – the separation of NHS England from the Department of Health – didn’t work. The NHS, and the expectations that are set for it, remain as politicised today as they were in 2009.

This is because the NHS is not politicised for structural reasons but for political ones. At the time of writing, the latest YouGov data has 44% of voters citing the NHS as one of the top issues facing the country, second only to the economy. Politicians chasing votes are competing on the promises they make about the NHS and none of them seem to think that “this is NHS England’s decision and I won’t meddle” is a very good line.

So if we can’t realistically take politics out of the NHS, we are left with the hope that we will have a better and more honest politics that is more focused on actually trying to improve things than media soundbites. Like I said, it’s much easier to point at a problem than to solve it.

Protecting the system

If the NHS is stuck with politically-driven fictions then managers at each level of the system have a choice. They can either pass the problem down the chain or they can try to shield the NHS and set realistic resource bargains that allow the system to function effectively. Finance directors in Integrated Care Boards can either demand the impossible when they commission services from providers, or they can have honest discussions about how they manage external expectations and deliver the best outcomes for their population. NHS providers can choose whether or not they pass unrealistic demands onto clinical teams.

This takes us back to the “tactics of engaging with NHS England.” Senior managers have to walk a political tightrope to avoid regulatory intervention while maintaining realistic and deliverable plans for their organisations. But if we want the NHS to be more effective and efficient – and a nicer place to work – then we need to reduce how much of it is exposed to, and how much management time is spent on, wretched financial plans.


[1] If you want to apply the Viable System Model to your organisation you should get hold of a copy of Stafford Beer’s Diagnosing the System for Organisations. If you want to know more about the topic but prefer to read something entertaining then you can pre-order Dan Davies’ new book

The limits of utilitarianism in health care

Lord Sumption has come under fire for comments he made in BBC a debate about whether lockdown was “punishing too many for the greater good”, where he told a woman with stage 4 cancer that her life was “less valuable” than other people’s.

He was saying this as part of his argument against lockdown, which is broadly that it punishes the young to save the old. Others have pointed out that this argument doesn’t work, because the young are hardly going to benefit from an overwhelmed NHS, dead parents and collapsing consumer spending among the wealthiest age group. Covid policy is not, in general, a trade-off between wealth and health, and it’s certainly not a zero sum game between generations.

But I want to set that aside and look at the argument on its own merits. Do we, and should we, consider some people’s lives less valuable than others when setting health care and wider government policy?

Within health care, there are places where we are very explicit about how we value lives. When NICE looks at the cost-effectiveness of new drugs, it will only approve them for use in the NHS if they cost less than £20,000 to £30,000 for each QALY (quality adjusted life year) they deliver[i]. A lifesaving intervention for a younger and healthier person will, other things being equal, deliver more QALYs than one for an older, sicker person, so we are willing to pay more for it. When it comes to how much we pay for drugs, we are explicitly utilitarian.

When we look more broadly at health care activities, however, things get messier. While health economists and policy-makers do try to assess the cost-effectiveness of interventions in a broadly utilitarian way, the reality of delivering health care often works out differently. For all the talk of prioritising community care and prevention, funding and activity continue to be sucked into hospitals and emergency care, and the last two years of someone’s life are by far the most expensive for health care. This is partly about the difficulty of managing change in a complex system, but also because there is a moral framework at play here that isn’t strictly utilitarian – we feel obligated to help people who need it and to “save someone’s life”, even if we might get more QALYs using the money somewhere else.

The allocation of government resources beyond health care diverges even further from a utilitarian ideal. While the cost-effectiveness of policies is assessed, the concept of QALYs is largely limited to health policy evaluation and there is no grand model that ensures a pound doesn’t get spent on roads if it could deliver slightly higher marginal utility in schools. Moreover, spending isn’t really allocated according to cost-benefit analysis when it comes down to it. The Treasury coordinates a fairly rigorous spending review process with other departments, but decisions on what money goes where will ultimately be made by ministers, based on what they think the public want and what they think will win them votes.

And so we end up with our public resources distributed through a messy combination of utilitarianism, public opinion, politics and accident. While this does lead to some indefensible decisions and pork-barrel politics, the fact that we have such a mixed approach is not a regrettable failure to implement our utilitarian principles, but a reflection of what we actually believe. There is a tension between our utilitarian sensibilities and our ethical and democratic ideals that all people are equal. Although we try to formalise this to some degree by looking at equalities alongside cost-benefit analyses, “equalities impact assessments” are often a bit of an afterthought, and we don’t have a way of trading of net utility against equalities – they are two separate frames that remain in tension.

This is where Lord Sumption gets it wrong – or at least voices a fringe opinion. There is a place for utilitarianism in public policy. It’s an important part of what people believe is fair, and can be implemented pretty explicitly in narrow applications like NICE’s drug assessments. But if we let it become our whole approach for allocating resources or deciding on policy, we ignore a widespread and fundamental belief that all people are equal, with equal rights, including the right to life. The next thing you know, you are on the BBC telling people who are old or disabled (both protected characteristics in equalities law!) that they are worth less than others. It’s not clear that this is ethically sound or sustainable in a democracy. We’re better off with the messy compromise that we’ve got.


[i] The fact that the threshold is in fact a range might suggest that the process is not as strictly utilitarian as it first appears.

Do the Covid vaccines vindicate our model of pharmaceutical development?

The development of three highly effective vaccines in record time was not only a rare piece of good news in 2020, but an incredible scientific achievement – and one delivered by our much-maligned drug companies. So often seen as the bad guys, Big Pharma has ridden to our rescue when we needed them the most. So does this mean that our system of drug development is working just fine after all?

It is said that war is a major driver of innovation. The idea is that an all-consuming threat brings a clarity of purpose and focuses a nation’s resources on solving specific problems. This leads to technological jumps in certain areas, which then have wider applicability when the war is over – in aviation, radar or nuclear physics. The Covid-19 pandemic was the pharmaceutical industry’s war. While in normal times research and development is spread across a range of diseases, suddenly it was absolutely clear what the priority was – and, crucially, absolutely clear that if you developed an effective treatment or vaccine you would sell bucketloads of it. With such a singular clarity of purpose, our drug development system has delivered, and in some style.

But what does this impressive system do in peacetime? Like any other market, the answer is that efforts are directed towards the things that are most likely to make money. Unlike many other markets, however, the ability to make money is entirely dependent on government regulation – and specifically patents. This is because pharmaceutical R&D is very expensive, but the marginal cost of manufacturing a drug is very cheap. The value of R&D is held in the intellectual property, so for there to be any incentive to develop new drugs, this needs protecting. While drugs are under patent they are hugely profitable because the manufacturer is granted a government-sanctioned monopoly, but as soon as the patent expires anyone can manufacture a generic version and the profitability largely evaporates.

The problem with profits relying so heavily on regulation is that the nature and specific detail of those regulations – rather than patient demand or social benefit – start to be the main factors driving behaviour. This has resulted in the development of a range of “me-too drugs”, designed to be just different enough from an existing product to get a fresh patent, with little regard to whether they provide a significant benefit to patients over and above what’s currently available. In normal times, a large slice of pharmaceutical R&D effort goes into these sorts of products, which are a less risky way to deliver profits than pursuing genuinely novel products.

In stark contrast to the response to Covid-19, these incentives leave some of our biggest public health concerns woefully underserved by pharmaceutical R&D. More than 700,000 people are estimated to die each year as a result of antimicrobial resistant infections, which the WHO describes as a global crisis. But this crisis – or rather the volume of drugs that you would sell if you fixed it – just isn’t big enough to convince the industry that it’s worth going through the expensive and risky R&D process required to develop genuinely novel medicines. Many drug companies have simply stopped working on new antibiotics. Of those that are in development, many are me-too products with limited benefits over what’s already available and only two out of 50 are active against the multi-drug resistant Gram-negative bacteria, which the WHO considers a top priority.

This year has shown the incredible scientific capability that we have been able to maintain across our universities and the pharmaceutical industry, and how effectively they can work together to develop innovative techniques and crack difficult problems. Whatever else our system has or has not been doing, we can be thankful that it has achieved this. But we also know that in normal times, the current system of regulations and incentives fails to target this capacity at our biggest public health problems.

There are two different lessons we might take from this. One is that, in the absence of anything better, we at least have a system that maintains an impressive capacity that can deliver incredible results if we ever find ourselves in a truly all-consuming crisis. Poorly targeted R&D in normal times might be a price worth paying for this, and allowing companies to play the regulations for huge profits a necessary evil. Or we may take the view that this year has shown us what could be possible under a different system. If we were able to focus pharmaceutical R&D on novel discovery in areas of genuine priority, perhaps we could deliver astounding results every year, without the need for a global pandemic.

Pull the lever

Why you should probably vote for the least bad party that can win in your constituency

It’s election day and we’ve got choices to make. Of course, we have choices to make every time an election comes around, but for many people – seemingly more than usual – none of the options are very appealing. As ever, there are only two parties capable of forming a government, but the realisation in recent years that both have serious problems with institutional racism has left many people feeling that voting for either is morally unacceptable.

So what should you do in this situation? Some of us are lucky enough to have an easy answer. If you live in a seat where another party (that you actually like) can win then you can simply vote for them. If you live in a very safe Tory or Labour seat then you can also vote for your favourite party knowing that it won’t affect the election result. But if you live in a Tory/Labour marginal, then I’m afraid that you are stuck in a trolley problem.

The trolley problem is a thought experiment where a trolley (or a train) is hurtling along and five people are tied to the track ahead. If you do nothing they will be killed. There is a lever to divert the train down another track to which one person is tied. If you pull the lever you will save five people but kill one – what is the morally right thing to do?

The point of the though experiment is to explore the moral equivalence between action and inaction: is doing nothing morally neutral, or are you responsible for five deaths? If you pull the lever are you a murderer or have you saved four lives? While this has been the subject of years of debate among moral philosophy undergraduates, empirical research suggests that nine in ten of us would pull the lever.

What this means is that most of us don’t consider abstention a morally neutral choice. If both options are unpalatable, but one is worse than the other, failing to choose the less bad option allows the worst to happen. If you find both the Tories and Labour unpalatable, but believe that one is worse than the other – for example if you oppose racism but believe in strong public services / think that nationalisation would be a disaster – then voting for a third party in a Tory/Labour marginal means you are not using your vote to prevent the worst outcome.

I’m not here to tell you what’s morally right, and the fact that nine in ten would pull the lever in a trolley problem means that 10% of us don’t think that’s the right thing to do. But if you are in the majority that would pull the lever, and you find yourself in a trolley problem today, then you should vote for the least bad candidate with a chance of winning, however unpalatable you find them.

Gotta get yer gotchas right

The gotchas around the Conservative pledge to recruit 50,000 more nurses are wrong – but the truth is actually worse.

The Conservative announcement that they will “deliver 50,000 more nurses” has not gone down as they would have hoped. Labour has picked up on the fact that some of this increase will be delivered by better retention of existing staff. Nicky Morgan had a particularly uncomfortable experience trying to explain her way out of this on Good Morning Britain, as presenters (and probably viewers) became increasingly incredulous.

The problem is that this criticism is wrong-headed. Increasing the size of the nursing workforce isn’t just a case of saying so – it’s a stocks and flows problem. If we want a larger nursing workforce, we need to increase the flows in (through more attractive, better-funded training, or recruitment of nurses from overseas) and decrease the flows out (through better retention). The Conservative manifesto refers to policies that are designed to do this, such as reinstating the bursary for student nurses. We might think that the 50,000 figure is overegging the effects of these policies – the Health Foundation has said that in reality half will need to come from overseas – but you wouldn’t want to attempt this without looking at retention.

That said, there’s a bigger problem with this commitment – or at least how it is being sold and understood. The manifesto costings earmark £759m for this policy in the first year. You may have noticed that this is much less than the cost of employing 50,000 nurses (which Full Fact has estimated as at least £2.8bn). That’s because this money isn’t for paying nurses salaries at all. It is just for the policies, like the student bursary, that the government hopes will improve recruitment and retention. It means that NHS England may have a better supply of skilled nurses to employ, but it doesn’t pay their wages.

So what does this mean for the number of nurses that will actually be working in the NHS? Well, what it certainly does not mean is that there will be 50,000 more nurses working in our hospitals and communities than there would be in the absence of this announcement. That’s not to say nurse staffing levels won’t rise: the government has already announced increased NHS funding for the coming years and some of that might be spent on providing more nursing. But this new policy is about developing the nursing workforce, not about funding more nursing care.

Almost everything I have read about the policy has misunderstood this point – and I doubt that would have been lost on the authors of the manifesto. Much cheaper to announce some measures that you hope will lead to better recruitment and retention and let everyone think there will be 50,000 more nurses working in the NHS than to find the £2.8bn that would actually cost. There has to be a strong suspicion that this was a deliberate attempt to mislead.

The correct gotcha is therefore this: will there be 50,000 more nurses working in the NHS as a result of this policy? If so, the numbers don’t add up, since £750m can only pay for around a quarter of that number of nurse salaries. If not, can we be clear that this is just about training, recruiting and retaining people to fill existing jobs, or jobs that the NHS is already planning to create with previously announced funding?

Although, to be fair, that would not have been nearly as effective on Good Morning Britain.

The distributional implications of universality (again)

Paul Johnson, the director of the IFS, has an article in the Times (also available on the IFS website without a paywall) about how different ideas about fairness are behind some of our political disagreements. There’s plenty to agree with in the piece. But when he touches on a couple of themes that regular readers of the Policy Sketchbook will be somewhere between familiar with and bored of – social care reform and redistribution – Paul says some things that I think are a bit misleading.

Here are the offending paragraphs:

“The Conservatives got into dreadful trouble over their manifesto proposals on social care funding. We have spent decades making no progress on how to reform the funding system, partly because of the way we think about fairness. Some think it unfair that anyone should have to use their own assets, including their house, to pay for care. Yet one of the reasons why proposals to cap the amount that anyone has to pay have not been implemented is because, compared with the system we have today, the winners would be the relatively well-off.

In fact, this is a fundamental disagreement about the role of the state as much as it is about fairness. If you think the state is there to provide a degree of social insurance, stepping in where private insurance markets don’t work to pay for those who are unlucky enough to need care, then you are likely to favour it paying all the costs above a certain level. That’s how we tend to think of the NHS. But if you think the state is there just to redistribute money from rich to poor then you might think it unfair.”

This is a familiar take: moving to universal benefits means less redistribution and benefits the well-off. But is it true? Well, that depends. The most important thing to remember when thinking about the distributional impact of changes in government spending is that the money doesn’t just appear out of thin air. The effect of a policy on the level of redistribution that government does depends on how it is paid for. By choosing different funding sources you can get pretty much any distributional effect you want, but some scenarios are more relevant and plausible than others.

Three different ways of paying for a universal benefit

So let’s take a look at the distributional consequences of moving from a means-tested benefit to a universal one, paid for in different ways. We’ll use a stylised example for clarity, but the conclusions generalise pretty well. Imagine we have a benefit worth £1000 per person, but means-tested so that only the bottom 30% of the income distribution get it. An independent commission recommends making this universal, so that everyone gets the benefit regardless of their income. There are broadly three ways we can pay for this and each has different distributional consequences.

Reducing means-tested benefits to pay for universal benefits is regressive

One way to pay for the new universal benefit would be to reprioritise some money that is currently spent on means-tested benefits. It’s trivial to see that this is going to be regressive, but let’s run the numbers anyway. Let’s say we take the money that is currently spent on our stylised means-tested benefit and use it to fund a universal version. Instead of the bottom 30% of the income distribution getting a benefit worth £1000, everyone now gets one worth £300. The bottom 30% lose £700 each and everyone else gains £300. This is nailed-on regressive and it would be a similar story if the money were reprioritised from some other area of means-tested spending.

Means-testing one universal benefit to pay for another is distributionally neutral

Another way of paying for the new universal benefit is to reduce universality in another area. This is the sort of thing that was discussed in the wake of the Dilnot Report: universal coverage for social care could be funded by means-testing some of the universal benefits that older people currently get, like winter fuel allowance or free bus passes. The distributional consequences of the switch would depend on the details, but it would be roughly neutral – we are taking money away from the same people who will get more from the new benefit.

Paying for a universal benefit through higher taxes hits the rich

The third way that we could pay for the new universal benefit is through higher taxes. We can design taxes with various distributional profiles, but we can get an idea of who would be hit by a “typical” tax rise if we look at the distribution of current UK taxes as a whole.

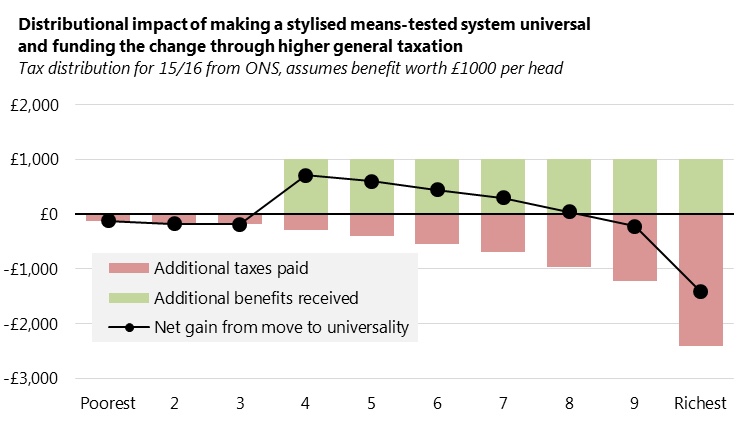
The chart below (based on ONS data) shows the distributional impact of extending our £1000 benefit to the whole population and funding it through an increase in “general taxation” – by which we mean a tax rise with the same distributional profile as the current UK tax system. The (positive) green bars show the additional benefits people in each income decile get and the (negative) red bars show the additional taxes they pay. The red and green bars sum to zero because, at risk of labouring the point, the money has not appeared out of thin air.

The winners from this shift to universal benefits are not the poorest, who already got the benefit, but it would be misleading to say they are the “relatively well-off”. The winners are the people in the middle, especially those just above the current means-test threshold. The biggest losers by far (in cash terms) are the richest 10%. This is a key point: the main distributional effect of a tax-funded change from means-tested to universal benefits is to move money from the people at the top of the income distribution to the people in the middle.

But you may have noticed something else in the chart. The bottom 30% of the income distribution also lose out, because they pay more tax and don’t get any additional benefit. They don’t pay much in absolute terms, but relative to their income it’s quite a lot. The chart below shows the same figures as a proportion of income: the richest still pay the most on this measure, but now the poorest are not far behind.

Now, unless you think that the bottom 30% do rather too well out of government as things stand, this doesn’t seem particularly fair. Luckily, it’s cheap to fix, since the bottom 30% only pays 7% of the cost of this policy if the money is raised through general taxation. If we were to exempt them from these tax rises, we’d still have enough to fund a universal benefit worth £970 for the rest of the population. But the point is worth noting: if universal benefits are to be funded through tax rises, the additional taxes shouldn’t hit the poorest.

The size of the state

So we’ve seen three different ways of paying for a new universal benefit with three different distributional effects: regressive, neutral and progressive. It should be obvious by now that unless you are clear which one of these you think will happen, you shouldn’t be saying anything about the distributional consequences.

How we assume the additional spending will be balanced rather depends on our assumptions about the size of the state. If we believe that tax rises are impossible or highly undesirable, then we are going to want a new universal benefit to be paid for by reprioritising spending. Up to a point we can reprioritise from other universal benefits and get something distributionally neutral – but so much of the British state is already means-tested that (unless you are willing to go for pensions or the NHS) there is limited capacity for such reprioritisation. With a fixed public spending envelope and tax profile there is only so much universality you can afford if you also want to do a certain amount of redistribution and under these assumptions, Paul’s claim that “the winners would be the relatively well-off” is just about defensible – although for a small spending item like the Dilnot reforms it would be quite easy to reprioritise spending in a neutral or progressive way.

But if we assume that more universal benefits will mean higher taxes then the picture looks very different. As shown above, the biggest losers from this would be the richest and the winners would be the people in the middle. And there are a couple of reasons to believe that this is ultimately the more reasonable assumption.

The first is that the people who are in favour of universal benefits tend to be the people who are in favour of higher taxes. Elect a government that does one, they are likely to do the other. We can see this in the recent Labour manifesto, where universal free university tuition was proposed, funded by an increase in income tax. Although the Dilnot Commission didn’t say much about how its proposals should be funded, the previous abortive attempt at social care reform (Labour’s National Care Service) was to be funded by an increase in inheritance tax.

The second is that countries with more universal benefits tend to have higher tax rates. There’s more going on in these figures than just universality versus means-testing, but in general the countries with the most universal benefits, such as the Nordics, France and Belgium, raise the most in taxes. Internationally, means-testing goes with low taxes and universality goes with high taxes.

Some conclusions

To be fair to Paul, he is far from the only person to go around saying that universal benefits are regressive. It’s even true under certain assumptions – specifically that the UK must remain a low tax country. The problem is that no one who writes opinion pieces saying that universal benefits are regressive ever seems to find space to clarify that this is their assumption. If they did, readers would probably notice that this isn’t what the proponents of universality are usually proposing, and it isn’t what countries with more universal benefits do. Moving towards a European model with more universal benefits and higher taxes would most likely amount to a transfer from the rich to the people in the middle of the income distribution. I doubt that fans of redistribution would, as Paul suggests, think this is unfair.

Prevention, longevity and health system costs

Kailash Chand has a piece in the Guardian arguing that unless the NHS fundamentally changes its approach to focus on prevention rather than cure, it will not be financially sustainable. This reminds me that many well-informed people hold inconsistent views on prevention and health spending.

Ask most people why health spending is rising and they’ll tell you it’s because people are living longer. But why are we living longer? According to the Lancet, the main causes are falling tobacco use in men – the result of a hugely successful public health campaign to prevent smoking-related diseases – and falling cardiovascular mortality – which is closely related to how much exercise we do. So prevention is a major driver of people living longer, and people living longer is leading to higher health care costs. Does that mean that prevention is bankrupting the NHS?

We can begin to unscramble this mess when we realise that mostprojectionsof health spending estimate that the contribution of ageing populations to spending growth is quite small, because as people live longer lives they are also healthier at any given age. This is reflected in the fact that a large proportion of health care costs relate to the last few years of someone’s life, however long that life is. An 85-year-old has on average a third of their health care costs still to come, but someone who dies younger doesn’t avoid these costs, they just incur them earlier.

So dying is expensive, but not all deaths are equally dear. A recent US study found that dementia is the most expensive way to die, once social care and out-of-pocket spending are factored in. This is bad news because we don’t really know how to prevent dementia. There are some promising interventions, and recent evidence suggests that age-specific rates might be falling, but the evidence that we can prevent dementia is currently fairly weak. The risk of developing dementia rises rapidly with age, so it’s plausible that if we prevent people from dying of other things then they will live long enough to develop dementia and end up costing the NHS more.

Now I’m not really trying to argue that prevention increases costs. It’s very complicated to work that out and, at a whole system level, empirical evidence is hard to come by. Moreover, there are some areas where prevention does seem to save money. A recent evaluation of diabetes prevention in the NHS found that it was likely to be cost saving (after 12 years) – and to be fair, diabetes is one of the examples that Kailash cites. Targeted interventions like this, especially those focusing on diseases like diabetes that don’t kill us but cost money, could help with sustainability. But it’s far from clear that a system-wide shift towards prevention is going to stop health spending from going up.

This is no reason not to do more prevention, of course. Living longer and with fewer diseases is a great thing in itself and if preventive interventions can help us to do that then we should implement them, whether they are cheaper or more expensive than our current approach to health care.

But acting as if prevention (or integration, or anything else) is the answer to all of our concerns about the sustainability of health spending is not helpful. It reinforces the idea that rising health spending is a symptom of failure and always bad – but if what we get for the money is longer, healthier lives, it might well be worth it. And in doing so it lets the current government off the hook for their persistent underfunding of services and distracts from more important questions. If we want the NHS to meet the needs of an ageing population and provide us with the latest treatments, we might just have to accept that this means putting in more public money and paying for this through higher taxes.

Toby Young and the power of education

Toby Young is in the news again. The Tories’ favourite born again educationalist has been given a seat on the board of Jo Johnson’s new universities “regulator”, the Office for Students. This gives me an excuse to publish something I failed to put out last time he was in the news, for claiming that schools can’t do much to reduce inequalities in attainment.

Toby Young has been at the centre of some controversy about the ability of schools to help disadvantaged children. He wrote an article for Teach First arguing that schools can’t really achieve much, which the charity subsequently took down because they disagreed with it. The article is now published on Toby’s blog, and he has been anointed by some as a free speech martyr (although he very modestly says that “martyr is putting it a bit strongly”).

But what about that article? Is it right?

There are a few different threads to it, including Toby’s usual futurology about IQ-enhancing drugs, but the central claim about the efficacy of schools is based on research that attributes variation in GCSE results to different causes. According to Toby, this research finds that IQ accounts for 60-70% of the observed variation in results, differences between schools (such as funding, class size and quality of teachers) account for 10% and the other 20-30% is accounted for by other environmental factors.

I don’t know this research so I’ll leave it for others to debate whether it’s any good and whether Toby is describing it correctly. The results are presumably from a multiple regression of observational data, so the usual caveats about causation versus correlation and unobserved variables will apply. But let’s set that to one side and take the results at face value: what do they mean for schools policy?

The conclusion Toby draws is a tempting one: that schools can’t do much to ameliorate the effects of inequalities. I think that’s the wrong conclusion to draw from these numbers for three reasons, which I’ll address in order of increasing complexity.

The first is trivial: reducing inequalities in attainment by 10% sounds like a major achievement to me. We should do this! (In fact it may be slightly unfair to suggest Toby is arguing otherwise.)

The second is more subtle and requires us to think about what those numbers actually mean. 10% of the observed variation in GCSE results is accounted for by the observed variation in school characteristics. So if we were to equalise all schools on these characteristics (things like funding, class size and quality of teachers) then variation in results would reduce by 10%. If the only intervention we could possibly make in schooling was to equalise these things across schools, then we could only eliminate 10% of current variation in attainment. But this isn’t the only thing we can do. What if we made schools in deprived areas better than those in more affluent areas? What if we gave additional help to the children who face the greatest disadvantages at home? The 10% figure tells us nothing about the efficacy of these things.

The third also relates to the way that 10% figure is constructed. It’s the variation attributed to differences between schools divided by total observed variation, so it’s a function of three things: how big the differences are between schools, how strong an effect school differences have on attainment, and how much variation there is from other sources (like home environment and IQ). So we can’t just look at the 10% figure and say that’s a small number so schools can’t have a strong effect on children’s attainment. If our schools were much more unequal in funding and class size then this number would go up, while if they were identical on these measures it would go down to zero – but these changes would tell us nothing about the power of education to drive attainment. If we were able to reduce variation due to other environmental factors (say, by reducing income inequality between the families of schoolchildren) then the 10% schools figure would increase. This would not mean that schools had become more effective at driving attainment.

So taking all of this into account, what can these figures tell us about schools policy? What would we do differently if this figure were 50% instead of 10%? It seems to me that the answer to both these questions is “very little”. Either way we should make sure that already-disadvantaged children don’t end up in schools that have fewer resources, larger class sizes and worse teaching, since these factors do compound their disadvantage. Either way we should consider helping disadvantaged children with targeted policies, about which these numbers tell us nothing. Where interventions cost money, we will want to know if the effect size is large enough to justify that expenditure, but these numbers tell us nothing about the absolute effect size of school interventions.

In fact, it’s hard to conclude that these numbers are much use at all for policy. The nature versus nurture debate has become an ideological battleground, but its relevance to education policy seems very limited. We can’t control nature, but we can decide how to nurture our children. We can do that by designing, testing and implementing good education policies. Whether in the end these policies explain more or less of the population-level variation in attainment than genetics is rather beside the point, if they are effective and cost-effective at improving attainment and reducing inequalities. It’s easy to see this if you consider an example from another policy area: if you have a demonstrably cost-effective behavioural intervention that reduces the chances of high-risk people developing cancer, but I tell you that only 10% of the observed variation in cancer risk is related to behaviours, does that have any bearing on whether you implement your policy?

The distributional impact of scrapping tuition fees

Since Labour decided to make the abolition of tuition fees a central piece of their election manifesto, we have been treated to a healthy stream of articles arguing for and against the proposal. There are lots of different arguments to be made here, but this post is just going to focus on one: whether abolishing tuition fees would be regressive.

This seems to be a popular line of criticism among centre-left commentators and Tory politicians alike, and they appear to have some heavyweight backing in the form of the IFS. However, since “regressive” is a poorly defined term and routinely abused in public policy debates, it’s generally a good idea to be suspicious this sort of claim. So let’s take a closer look at how tuition fees (and the idea of scrapping them) hold up against different definitions of “progressive” and “regressive”.

Tuition fee repayments raise more money from richer people

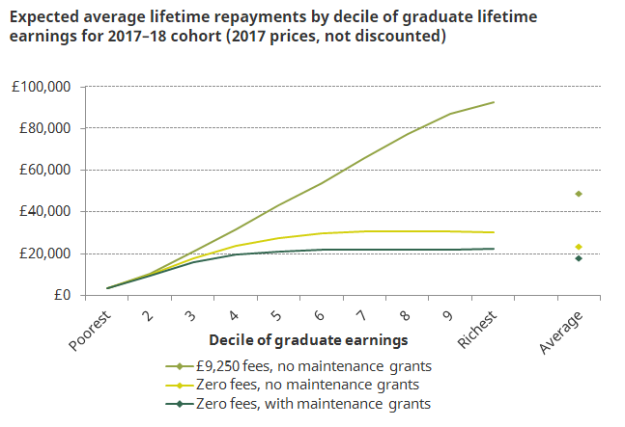
The IFS has done some modelling of tuition fees to work out how much graduates with different levels of lifetime earnings will repay. They find that higher fees mean that most people will never repay all of the money they borrow, so graduates who go on to earn more end up paying more for their tuition. Here’s a chart they published a couple of months ago comparing lifetime repayments under the current system with Labour’s proposal to scrap tuition fees and reintroduce maintenance grants:

It’s fairly clear from this chart that tuition fees are, under a certain definition of the term, progressive. People who go on to be richer pay more into the system while those who go on to earn the least pay no more than they would under Labour’s proposals. So if we define the term progressive to mean that richer people pay more then this is clearly a progressive way to raise money to fund our universities.

As a proportion of income, the richest 10% of graduates pay less than the next 40%

It’s no great surprise that rich people pay more, since repayments are proportional to earnings. In fact, the IFS notes that “for [the] majority of individuals, student loans are almost indistinguishable from an additional 9% graduate tax on their earnings” (or more precisely, their earnings above £21,000). But if we are going to think about student loan repayments as a kind of income tax then this suggests another definition of progressivity. Taxes are often called progressive if richer people pay more as a proportion of their income, not just in absolute terms. This definition sets the bar a bit higher – so do tuition fee repayments clear it?

The IFS doesn’t show these figures as a proportion of lifetime income, but I was able to cobble together a rough version based on the charts in their latest briefing note on the subject. The charts below show the difference in repayments between the current system and Labour’s proposal (i.e. the distance between the top and bottom lines in the IFS chart above) in absolute terms and as a proportion of lifetime income.

Now the picture looks a bit more complicated. Student loan repayments remain progressive at lower end of the income distribution. This is because repayments aren’t taken from the first £21,000 of your income and many graduates with the lowest lifetime incomes never earn much above this threshold. However, repayments now begin to look faily regressive at the top end of the income distribution. The richest 10% of gradutes contribute a smaller share of their income than the next richest 40%. This is because if repayments are a graduate tax, they are a tax with capped lifetime repayments. Once the full loan has been paid off, you stop paying tax. A significant proportion of the top 10% of earners pay off the full loan well before the 30-year limit (when it is written off), so they pay this tax for a shorter amount of time than everyone else.

So student loan repayments are progressive at the bottom of the income distribution, but under certain definitions they are regressive at the top end. But of course, that’s not really the question we are trying to answer here. We want to know whether abolishing tuition fees would be regressive. The IFS seem to think they have answered this question with the chart above, saying that “as high-earning graduates repay the largest share of their student loans, they benefit the most from the removal of tuition fees”. This, however, is nonsense. Unless they believe that we are going to replace the funding that universities lose with money that we have conjured out of thin air, they simply haven’t done the analysis that is required to prove or disprove this claim.

There are other progressive ways to fund university tuition, such as taxes

To work out the impact of abolishing student loans we need to have an idea of what will replace them as a funding stream for universities. The answer is of course that universities will get more direct funding from government, which will in turn be funded by higher taxes now or in the future, or by reductions in other areas of government spending. If the net effect of abolishing tuition and raising whatever taxes (or cutting whatever services) will pay for it leads to rich people doing better and poor people doing worse, then it seems reasonable to call the change regressive.

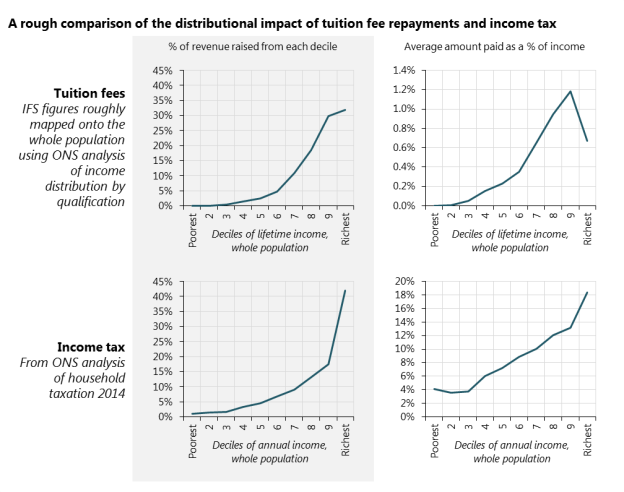
There are countless different ways to increase taxes, but since we are equating loan repayments to a sort of income tax, let’s focus on that. The chart below shows how the distributional effects of tuition fees compare with income tax.

(Since the IFS charts are based on the graduate income distribution – and graduates are richer than the rest of the population – they understate the progressivity of tuition fees in the population as a whole. I have roughly mapped the figures onto the population-wide income distribution so that we can make a better comparison with income tax figures. The mapping is very approximate, so please take the numbers with a pinch of salt.)

Compared to income tax, tuition fee repayments take less money from the people right at the bottom of the income distribution. This makes intuitive sense: income tax kicks in at £11,500 but tuition fees don’t kick in until £21,000 – plus there are more non-graduates at this end of the distribution who don’t make any repayments at all. At the other end of the distribution, tuition fees also take less money from the richest. The top decile pays around 40% of all income tax, but only around 30% of tuition fee repayments. Again it’s not hard to see why: marginal tax rates increase with income under income tax but not under tuition fees; and many of the richest graduates pay off their loans early and then stop paying their 9% “tax”. The people who do worse under tuition fees are those in the top 40% of the income distribution but outside the top 10%.

So what would  be the distributional impact of abolishing tuition fees and raising the same amount of money through income tax (in a distributionally identical way to current income tax take)? Well you would take some money from the richest 10% and some more from the poorest 60% and give it to those in between. Is that progressive or regressive? Well it’s kind of both: regressive with respect to poor people and progressive with respect to the rich. Either way, it’s quite different to the IFS claim that high-earning graduates would benefit the most from the abolition of fees. If the money was raised by increasing income tax equally for everyone then the richest 10% would be the biggest losers.

Of course, there are lots of other ways to pay for scrapping tuition fees and some clearly are regressive. The tax system as a whole is less progressive than income tax and if the policy was funded by a hike in VAT, for example, poor people would end up paying much more than under the current system and rich people much less. If other areas of government spending were cut you could generate just about any distributional profile you wanted, but since a large part of government spending in the UK is targeted to low-income groups, many options would be less progressive than tuition fees. The point though is that you can’t say whether scrapping one funding stream is progressive or regressive unless you consider its replacement.

Labour’s tax proposals are more progressive than tuition fee repayments

As it happens, the Labour manifesto – in which scrapping tuition fees was the biggest spending item – set out a number of tax rises to pay for their spending commitments, including an increase in income tax. However, the Labour policy wasn’t to increase income tax equally for everyone, but to increase it for the top 5% of earners only. We don’t need to draw any more charts to see that this is a much more progressive way to raise money than tuition fee repayments: 100% of the revenue is raised from the top decile. This would only cover a bit more than half of the cost of scrapping tuition fees, but the manifesto also included promises to reverse recent cuts in inheritance tax and capital gains tax, and charge VAT on private school fees. Scrapping tuition fees and paying for it by making these sorts of changes to the tax system would mean poor people paying less and rich people paying more. It would be progressive.

In conclusion

So what have we learned from all this? Well, tuition fee repayments are a progressive source of funding for higher education, insofar as rich people pay more for the same product. The system is great for the poorest, who may not end up paying anything back at all. However, if you look at how much people pay as a proportion of their income – which is how we usually assess the progressivity of a tax – the system starts to look quite regressive at the top end of the income distribution and the richest 10% seem to do rather well.

But just because tuition fees are fairly progressive, this doesn’t mean that scrapping them is regressive. This would be true if loans were scrapped and people had to pay current tuition fees out of their own pockets, but that is not what is being proposed. If taxes are increased to pay for the change then there are plenty of ways that the net effect could be progressive – and plenty of other ways that it could be regressive. But with the sort of tax increases that Labour set out in their manifesto, it seems clear that the net effect would be to increase the overall progressivity of government activity.

Now I don’t mean to suggest that we should scrap tuition fees just because we can find a more progressive way to fund university education. Distributional effects are not the only criteria by which we need to assess policies. Moreover, unless we think that the state currently does too little redistribution, it’s not clear that we would want every policy change to be progressive – and if we do think that, shouldn’t we be rectifying it by reforming the tax and benefit system? The aim of the university system is to educate, not redistribute, and any effects on access for people from poorer backgrounds seem much more important to reducing inequalities than the direct distributional consequences of choosing between tax-based and loan-based funding. So let’s talk about whether higher levels of debt will put some groups off applying to university, or whether a move back towards tax-based funding would lead to caps on student numbers and exclude poorer applicants. Let’s ask whether scrapping fees would lead to lower per capita funding for our universities, and whether this is a good or bad thing. There are many valid arguments to be made for and against tuition fees, but the claim that scrapping them would be regressive is not one of them.

Disclaimer

The analysis in this post is very rough. I don’t have access to the IFS model so I’ve read numbers off charts in their reports, mapped graduates very approximately onto the population-wide income distribution and conflated lifetime and in-year repayments. It wouldn’t be hard for someone at the IFS to do this analysis properly – and I would argue they should have already done it if they are making claims about who benefits from scrapping tuition fees. I’m pretty sure that the results would be similar to mine, but I would be delighted to be proved wrong. The point of this post isn’t to defend scrapping tuition fees. It is to insist that before we use words like “regressive” to describe a policy, we need to do the distributional analysis properly.

The magic money tree

On Question Time this weekend, Theresa May was confronted by a nurse whose pay has been squeezed under the Coalition and Conservative governments. Her response to the nurse’s complaints was that “there isn’t a magic money tree that we can shake that suddenly provides for everything that people want”. Theresa May is of course right. There is, as far as we know, not a magic money tree. However, I fear that as an explanation for why nurses can’t have a pay rise, her statement is lacking.

That is not to say that there is no link between magic money trees and nurses’ pay. If there were indeed a magic money tree, then its harvest could surely be used to pay nurses more[1]. The absence of such a tree is a necessary condition for it being impossible to pay nurses more – but it is not sufficient. The reason for this is that there are types of money that are not magical and do not grow on trees. In failing to address the availability of this more mundane form of money, Theresa May has, not for the first time, not really answered the question.

A more charitable interpretation of Theresa May’s statement is that she is trying to argue that we can’t afford to increase government spending above current levels. Government spending is financed by taxes or debt, which must be repaid from future taxes, so the ability of a government to afford a given level of spending is dependent on its ability to raise taxes. One reason that some developing countries struggle to fund public services such as health care is that they have weak public institutions and so can’t raise taxes very effectively. The UK and most other rich countries are much better at collecting taxes and have larger public sectors. But their scope for public spending is not unlimited, for two reasons: high taxes and a large public sector might have a distortionary effect on the economy, discouraging economic activity and squeezing out the private sector; or democratic processes might limit the size of the state by voting out governments that raise taxes.

This is all very complicated and hotly disputed, but one way to understand whether the UK could conceivable have higher public spending is to look at how we compare to other countries. The chart below (based on OECD data) compares public spending as a share of GDP with GDP per capita, for all OECD countries where data is available[2].

On both measures, we are roughly in the middle. GDP per capita in the UK is about the same as Japan, France and Finland, higher than Spain and Italy, and a fair bit lower than most other Western European countries. Public spending (as a share of GDP) is lower than in most Western European Countries, but higher than Japan, Australia or the US.

It is also fairly clear that, as far as this dataset goes, there is no relationship between the two variables. Sweden, Austria and Denmark have much higher public spending than the UK, but this doesn’t stop them having much higher economic output. On the other hand, Australia and the US manage higher economic output with lower public spending. It seems that (within the range of this chart) pretty much any combination is possible. Of course, this doesn’t prove that higher taxes wouldn’t be bad for the UK economy. Perhaps our economy is so fragile that it would be crippled by any tax rises. But if you are going to argue this you are going to have to convince me that it is impossible for us to achieve what much of the rest of Western Europe can.

The political question is more difficult to analyse. Yes, other countries have larger public sectors, but they also have different political cultures. Perhaps the British are fundamentally different to our European neighbours and would simply not stand for the tax rises that are required to finance better health care and pay rises for nurses. Perhaps we are and will always remain a low tax country.

I don’t have a strong opinion on the optimal size of government, but I do wish we could have an honest debate about it. When someone says “we can’t afford it”, we need to be clear that this is nonsense. What they are really saying is that they do not think that we should raise the taxes required to pay for it. This is a debate that we need to have, but saying “we can’t afford it” is not the way to go about it.

The phrase “magic money tree” is even worse: it is designed to ridicule the suggestion that public spending should be increased. A nurse asking for a pay rise is as stupid as someone who believes that money grows on magical trees. Repeating this phrase whenever anyone suggests spending public money on something is not only nonsensical but frankly offensive.


[1] This statement is not the main point of this post and I don’t want to hear from any macro-economists about the inflationary effects of magic money trees.

[2] Excluding Ireland and Luxembourg, whose results are heavily distorted by their role as tax havens.