Tag Archives: public policy

Bad politics and bad management in the NHS

“To be clear,” wrote Richard Murray and Siva Anandaciva last year in the Health Service Journal (The Wretchedness of NHS Financial Planning, July 2023 [£]), “this is not fraud.” Richard was then Chief Executive of the King’s Fund, one of the country’s leading health think tanks, and Siva the Chief Analyst. 

When two of the country’s leading experts on the NHS have to clarify that what they are saying does not constitute an allegation of fraud against NHS finance directors up and down the country, we should take it as an indication that something is amiss.

Their article (which sadly is behind a paywall) describes how unrealistic demands are routinely made of NHS systems and providers, which are expected to deliver large and unspecified “efficiencies” without compromising the health care services they provide. It quotes a former local authority finance director who, on moving into the NHS, described “almost a mass collusion that doing ‘more with less’ was possible on this grand a scale.”

For the most part, NHS organisations play along with this for fear of being the first to step out of line and give NHS England the “wrong answer.” Occasionally though, one breaks cover. Another Health Service Journal article from last year [£] quoted leaders of a health system in Yorkshire openly admitting that they had changed their financial plans to say that they would break even as part of the “tactics of engaging with NHS England.” To be clear, however, this is not fraud.

Politics with different sizes of “p”

The NHS may well be the most politicised health system in the world. In a June 2022 edition of Radio 4’s The Briefing Room (18:24 onwards), Mark Pearson of the OECD identifies this as the main reason why the NHS seems to be struggling more than some other, similarly structured health systems. Politically-driven tinkering means that successive health secretaries introduce new reforms before the dust has settled on the last round. We never let anything play out and never learn what works.

Another consequence of this extreme politicisation is that unrealistic have-your-cake-and-eat-it demands come from the top. Ministers find it convenient to claim – and easy to get away with claiming – that the NHS can do more with less. Prevention, better integration of services, technology or unspecified “reform” are the balancing figure between what we want the NHS to be and the amount of money that the government is willing to spend. The problem is that prevention doesn’t save money and, despite years of trying, the NHS has still not found a replicable model of “integrated care” that delivers efficiencies. According to the Office for Budget Responsibility, in health care, “unlike most industries, technological innovations are generally cost-escalating rather than cost-containing.”

This cakeism permeates through the system. NHS England demands that health care systems and providers submit balanced financial plans, which say they will keep costs within their funding allocations. Alongside this, they are expected to manage changes in local demand for services and deliver on a range of centrally-determined priorities. The internal politics of the NHS mean that many finance directors decide that it’s better to submit a balanced plan that you are never going to stick to than be honest from the outset. NHS England knows exactly what is going on but finds it politically convenient to play along rather than call out unrealistic plans.

These politically-motivated fictions have a big impact on how the NHS is run. To understand why, we need to think about how complex systems work.

Unviable systems

In the 1980s, Stafford Beer developed the Viable System Model[1]. Starting from fundamental principles about managing complexity, the model describes how different layers of a system interact, the elements that need to be in place, and how information should be shared. If we can get our organisations working like this, they should be able to deal with complex stuff – like the health needs of a population – while being resilient to change and uncertainty.

In the model, the relationship between two layers of a system – say, between the senior management of an organisation and one of its operational divisions, or between health care commissioners and providers in one part of the country – is defined by the “resource bargain”. This describes the resources that are allocated and what is expected to be delivered in return. For example, the orthopaedic department in a hospital will be given a budget and expected to carry out a certain number of hip replacements and knee surgeries. The resource bargain defines the accountability that each part of the system has to higher levels of management. It also defines the autonomy that the department has: it can make changes to how it operates as long as it is still delivering the agreed outputs and staying within its budget.

Resource bargains in the NHS are agreed every year through the financial and operational planning process. NHS England sets financial allocations for each Integrated Care System. Annual planning guidance is published, describing priorities for the year, and this sits alongside a menagerie of longer-term plans and policies, many of which are “mandatory”. Integrated Care Boards then commission services from NHS trusts and set up contracts that say how much money each organisation will get and what it will provide in return.

The problem is that at one end of this chain of resource bargains are the claims made by ministers and at the other end is reality. Each layer of the system can choose to play along with the convenient fiction of always doing more with less, but reality tends to be less compliant. This tension has to be held somewhere, whether that’s an NHS provider spending more that it said it would, or clinical services being unable to deliver agreed levels of performance with the staff they can afford.

The “wretchedness” of NHS financial planning described by Murray and Anandaciva means that the resource bargains that should define autonomy and accountability throughout the NHS are wretched. What’s more, everyone involved knows this. But to be clear, this is not fraud.

Bad management

There are at least three ways in which this undermines good management in the NHS.

The first is that they are a huge and costly distraction. Senior managers spend large amounts of time and money on plans that they know aren’t realistic and aren’t going to happen. A fictional “breakeven” plan will be developed at the start of a financial year. When reality refuses to play along, a “recovery plan” is developed, perhaps with the help of expensive management consultants. This is supported by an “ambitious efficiency programme” with wildly optimistic savings. Board-level directors and chief executives spend large amounts of time in meetings about this stuff, which they all know is nonsense. This is not only expensive, but it takes managers away from the real business of running the NHS.

Another issue is that, after a while, people stop listening. They know that at the start of every year a “balanced” plan will be agreed; that part way through they year there will be a crisis when spending goes off track; and that towards the end of the year some money will be found to make it good. A rational response to this is to treat it all as noise. So senior managers find not only that they are spending their time managing fictions rather than reality, but that no one takes their exhortations to save money very seriously anymore. The resource bargains cease to function as a unit of accountability and managers often fill the gap with fear and a generalised sense of pressure.

A third problem is that putting unrealistic expectations onto health care teams makes the experience of working for the NHS much worse. When teams are told they have to do more with less, when the political narrative is that they should be meeting the needs of the population but they don’t have the resources to do so, NHS staff are overworked and still feel like they are failing. This is one factor driving the NHS’s rolling workforce crisis.

Altogether these issues leave the NHS less well managed than it should be, less efficient than it could be, and a worse place to work.

A politicised health system needs better politics

To give the former health secretary Andrew Lansley his dues (I know, but bear with me) he did identify this problem when he said we needed to take politics out of the NHS. Unfortunately, it is much easier to point at a problem than it is to solve it, and his solution – the separation of NHS England from the Department of Health – didn’t work. The NHS, and the expectations that are set for it, remain as politicised today as they were in 2009.

This is because the NHS is not politicised for structural reasons but for political ones. At the time of writing, the latest YouGov data has 44% of voters citing the NHS as one of the top issues facing the country, second only to the economy. Politicians chasing votes are competing on the promises they make about the NHS and none of them seem to think that “this is NHS England’s decision and I won’t meddle” is a very good line.

So if we can’t realistically take politics out of the NHS, we are left with the hope that we will have a better and more honest politics that is more focused on actually trying to improve things than media soundbites. Like I said, it’s much easier to point at a problem than to solve it.

Protecting the system

If the NHS is stuck with politically-driven fictions then managers at each level of the system have a choice. They can either pass the problem down the chain or they can try to shield the NHS and set realistic resource bargains that allow the system to function effectively. Finance directors in Integrated Care Boards can either demand the impossible when they commission services from providers, or they can have honest discussions about how they manage external expectations and deliver the best outcomes for their population. NHS providers can choose whether or not they pass unrealistic demands onto clinical teams.

This takes us back to the “tactics of engaging with NHS England.” Senior managers have to walk a political tightrope to avoid regulatory intervention while maintaining realistic and deliverable plans for their organisations. But if we want the NHS to be more effective and efficient – and a nicer place to work – then we need to reduce how much of it is exposed to, and how much management time is spent on, wretched financial plans.


[1] If you want to apply the Viable System Model to your organisation you should get hold of a copy of Stafford Beer’s Diagnosing the System for Organisations. If you want to know more about the topic but prefer to read something entertaining then you can pre-order Dan Davies’ new book

The distributional implications of universality (again)

Paul Johnson, the director of the IFS, has an article in the Times (also available on the IFS website without a paywall) about how different ideas about fairness are behind some of our political disagreements. There’s plenty to agree with in the piece. But when he touches on a couple of themes that regular readers of the Policy Sketchbook will be somewhere between familiar with and bored of – social care reform and redistribution – Paul says some things that I think are a bit misleading.

Here are the offending paragraphs:

“The Conservatives got into dreadful trouble over their manifesto proposals on social care funding. We have spent decades making no progress on how to reform the funding system, partly because of the way we think about fairness. Some think it unfair that anyone should have to use their own assets, including their house, to pay for care. Yet one of the reasons why proposals to cap the amount that anyone has to pay have not been implemented is because, compared with the system we have today, the winners would be the relatively well-off.

In fact, this is a fundamental disagreement about the role of the state as much as it is about fairness. If you think the state is there to provide a degree of social insurance, stepping in where private insurance markets don’t work to pay for those who are unlucky enough to need care, then you are likely to favour it paying all the costs above a certain level. That’s how we tend to think of the NHS. But if you think the state is there just to redistribute money from rich to poor then you might think it unfair.”

This is a familiar take: moving to universal benefits means less redistribution and benefits the well-off. But is it true? Well, that depends. The most important thing to remember when thinking about the distributional impact of changes in government spending is that the money doesn’t just appear out of thin air. The effect of a policy on the level of redistribution that government does depends on how it is paid for. By choosing different funding sources you can get pretty much any distributional effect you want, but some scenarios are more relevant and plausible than others.

Three different ways of paying for a universal benefit

So let’s take a look at the distributional consequences of moving from a means-tested benefit to a universal one, paid for in different ways. We’ll use a stylised example for clarity, but the conclusions generalise pretty well. Imagine we have a benefit worth £1000 per person, but means-tested so that only the bottom 30% of the income distribution get it. An independent commission recommends making this universal, so that everyone gets the benefit regardless of their income. There are broadly three ways we can pay for this and each has different distributional consequences.

Reducing means-tested benefits to pay for universal benefits is regressive

One way to pay for the new universal benefit would be to reprioritise some money that is currently spent on means-tested benefits. It’s trivial to see that this is going to be regressive, but let’s run the numbers anyway. Let’s say we take the money that is currently spent on our stylised means-tested benefit and use it to fund a universal version. Instead of the bottom 30% of the income distribution getting a benefit worth £1000, everyone now gets one worth £300. The bottom 30% lose £700 each and everyone else gains £300. This is nailed-on regressive and it would be a similar story if the money were reprioritised from some other area of means-tested spending.

Means-testing one universal benefit to pay for another is distributionally neutral

Another way of paying for the new universal benefit is to reduce universality in another area. This is the sort of thing that was discussed in the wake of the Dilnot Report: universal coverage for social care could be funded by means-testing some of the universal benefits that older people currently get, like winter fuel allowance or free bus passes. The distributional consequences of the switch would depend on the details, but it would be roughly neutral – we are taking money away from the same people who will get more from the new benefit.

Paying for a universal benefit through higher taxes hits the rich

The third way that we could pay for the new universal benefit is through higher taxes. We can design taxes with various distributional profiles, but we can get an idea of who would be hit by a “typical” tax rise if we look at the distribution of current UK taxes as a whole.

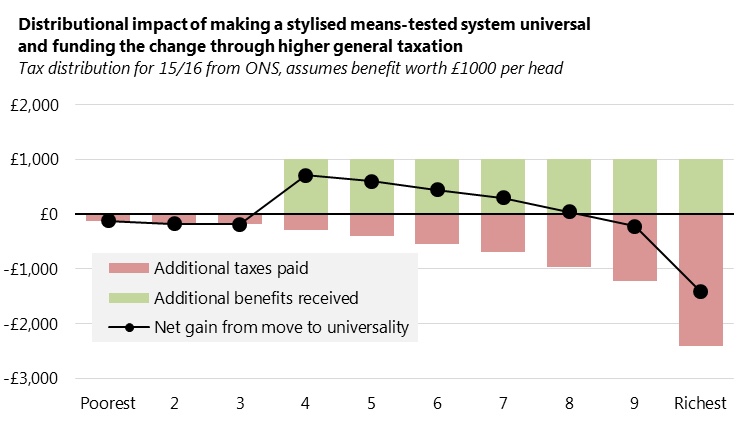
The chart below (based on ONS data) shows the distributional impact of extending our £1000 benefit to the whole population and funding it through an increase in “general taxation” – by which we mean a tax rise with the same distributional profile as the current UK tax system. The (positive) green bars show the additional benefits people in each income decile get and the (negative) red bars show the additional taxes they pay. The red and green bars sum to zero because, at risk of labouring the point, the money has not appeared out of thin air.

The winners from this shift to universal benefits are not the poorest, who already got the benefit, but it would be misleading to say they are the “relatively well-off”. The winners are the people in the middle, especially those just above the current means-test threshold. The biggest losers by far (in cash terms) are the richest 10%. This is a key point: the main distributional effect of a tax-funded change from means-tested to universal benefits is to move money from the people at the top of the income distribution to the people in the middle.

But you may have noticed something else in the chart. The bottom 30% of the income distribution also lose out, because they pay more tax and don’t get any additional benefit. They don’t pay much in absolute terms, but relative to their income it’s quite a lot. The chart below shows the same figures as a proportion of income: the richest still pay the most on this measure, but now the poorest are not far behind.

Now, unless you think that the bottom 30% do rather too well out of government as things stand, this doesn’t seem particularly fair. Luckily, it’s cheap to fix, since the bottom 30% only pays 7% of the cost of this policy if the money is raised through general taxation. If we were to exempt them from these tax rises, we’d still have enough to fund a universal benefit worth £970 for the rest of the population. But the point is worth noting: if universal benefits are to be funded through tax rises, the additional taxes shouldn’t hit the poorest.

The size of the state

So we’ve seen three different ways of paying for a new universal benefit with three different distributional effects: regressive, neutral and progressive. It should be obvious by now that unless you are clear which one of these you think will happen, you shouldn’t be saying anything about the distributional consequences.

How we assume the additional spending will be balanced rather depends on our assumptions about the size of the state. If we believe that tax rises are impossible or highly undesirable, then we are going to want a new universal benefit to be paid for by reprioritising spending. Up to a point we can reprioritise from other universal benefits and get something distributionally neutral – but so much of the British state is already means-tested that (unless you are willing to go for pensions or the NHS) there is limited capacity for such reprioritisation. With a fixed public spending envelope and tax profile there is only so much universality you can afford if you also want to do a certain amount of redistribution and under these assumptions, Paul’s claim that “the winners would be the relatively well-off” is just about defensible – although for a small spending item like the Dilnot reforms it would be quite easy to reprioritise spending in a neutral or progressive way.

But if we assume that more universal benefits will mean higher taxes then the picture looks very different. As shown above, the biggest losers from this would be the richest and the winners would be the people in the middle. And there are a couple of reasons to believe that this is ultimately the more reasonable assumption.

The first is that the people who are in favour of universal benefits tend to be the people who are in favour of higher taxes. Elect a government that does one, they are likely to do the other. We can see this in the recent Labour manifesto, where universal free university tuition was proposed, funded by an increase in income tax. Although the Dilnot Commission didn’t say much about how its proposals should be funded, the previous abortive attempt at social care reform (Labour’s National Care Service) was to be funded by an increase in inheritance tax.

The second is that countries with more universal benefits tend to have higher tax rates. There’s more going on in these figures than just universality versus means-testing, but in general the countries with the most universal benefits, such as the Nordics, France and Belgium, raise the most in taxes. Internationally, means-testing goes with low taxes and universality goes with high taxes.

Some conclusions

To be fair to Paul, he is far from the only person to go around saying that universal benefits are regressive. It’s even true under certain assumptions – specifically that the UK must remain a low tax country. The problem is that no one who writes opinion pieces saying that universal benefits are regressive ever seems to find space to clarify that this is their assumption. If they did, readers would probably notice that this isn’t what the proponents of universality are usually proposing, and it isn’t what countries with more universal benefits do. Moving towards a European model with more universal benefits and higher taxes would most likely amount to a transfer from the rich to the people in the middle of the income distribution. I doubt that fans of redistribution would, as Paul suggests, think this is unfair.

Toby Young and the power of education

Toby Young is in the news again. The Tories’ favourite born again educationalist has been given a seat on the board of Jo Johnson’s new universities “regulator”, the Office for Students. This gives me an excuse to publish something I failed to put out last time he was in the news, for claiming that schools can’t do much to reduce inequalities in attainment.

Toby Young has been at the centre of some controversy about the ability of schools to help disadvantaged children. He wrote an article for Teach First arguing that schools can’t really achieve much, which the charity subsequently took down because they disagreed with it. The article is now published on Toby’s blog, and he has been anointed by some as a free speech martyr (although he very modestly says that “martyr is putting it a bit strongly”).

But what about that article? Is it right?

There are a few different threads to it, including Toby’s usual futurology about IQ-enhancing drugs, but the central claim about the efficacy of schools is based on research that attributes variation in GCSE results to different causes. According to Toby, this research finds that IQ accounts for 60-70% of the observed variation in results, differences between schools (such as funding, class size and quality of teachers) account for 10% and the other 20-30% is accounted for by other environmental factors.

I don’t know this research so I’ll leave it for others to debate whether it’s any good and whether Toby is describing it correctly. The results are presumably from a multiple regression of observational data, so the usual caveats about causation versus correlation and unobserved variables will apply. But let’s set that to one side and take the results at face value: what do they mean for schools policy?

The conclusion Toby draws is a tempting one: that schools can’t do much to ameliorate the effects of inequalities. I think that’s the wrong conclusion to draw from these numbers for three reasons, which I’ll address in order of increasing complexity.

The first is trivial: reducing inequalities in attainment by 10% sounds like a major achievement to me. We should do this! (In fact it may be slightly unfair to suggest Toby is arguing otherwise.)

The second is more subtle and requires us to think about what those numbers actually mean. 10% of the observed variation in GCSE results is accounted for by the observed variation in school characteristics. So if we were to equalise all schools on these characteristics (things like funding, class size and quality of teachers) then variation in results would reduce by 10%. If the only intervention we could possibly make in schooling was to equalise these things across schools, then we could only eliminate 10% of current variation in attainment. But this isn’t the only thing we can do. What if we made schools in deprived areas better than those in more affluent areas? What if we gave additional help to the children who face the greatest disadvantages at home? The 10% figure tells us nothing about the efficacy of these things.

The third also relates to the way that 10% figure is constructed. It’s the variation attributed to differences between schools divided by total observed variation, so it’s a function of three things: how big the differences are between schools, how strong an effect school differences have on attainment, and how much variation there is from other sources (like home environment and IQ). So we can’t just look at the 10% figure and say that’s a small number so schools can’t have a strong effect on children’s attainment. If our schools were much more unequal in funding and class size then this number would go up, while if they were identical on these measures it would go down to zero – but these changes would tell us nothing about the power of education to drive attainment. If we were able to reduce variation due to other environmental factors (say, by reducing income inequality between the families of schoolchildren) then the 10% schools figure would increase. This would not mean that schools had become more effective at driving attainment.

So taking all of this into account, what can these figures tell us about schools policy? What would we do differently if this figure were 50% instead of 10%? It seems to me that the answer to both these questions is “very little”. Either way we should make sure that already-disadvantaged children don’t end up in schools that have fewer resources, larger class sizes and worse teaching, since these factors do compound their disadvantage. Either way we should consider helping disadvantaged children with targeted policies, about which these numbers tell us nothing. Where interventions cost money, we will want to know if the effect size is large enough to justify that expenditure, but these numbers tell us nothing about the absolute effect size of school interventions.

In fact, it’s hard to conclude that these numbers are much use at all for policy. The nature versus nurture debate has become an ideological battleground, but its relevance to education policy seems very limited. We can’t control nature, but we can decide how to nurture our children. We can do that by designing, testing and implementing good education policies. Whether in the end these policies explain more or less of the population-level variation in attainment than genetics is rather beside the point, if they are effective and cost-effective at improving attainment and reducing inequalities. It’s easy to see this if you consider an example from another policy area: if you have a demonstrably cost-effective behavioural intervention that reduces the chances of high-risk people developing cancer, but I tell you that only 10% of the observed variation in cancer risk is related to behaviours, does that have any bearing on whether you implement your policy?

The distributional impact of scrapping tuition fees

Since Labour decided to make the abolition of tuition fees a central piece of their election manifesto, we have been treated to a healthy stream of articles arguing for and against the proposal. There are lots of different arguments to be made here, but this post is just going to focus on one: whether abolishing tuition fees would be regressive.

This seems to be a popular line of criticism among centre-left commentators and Tory politicians alike, and they appear to have some heavyweight backing in the form of the IFS. However, since “regressive” is a poorly defined term and routinely abused in public policy debates, it’s generally a good idea to be suspicious this sort of claim. So let’s take a closer look at how tuition fees (and the idea of scrapping them) hold up against different definitions of “progressive” and “regressive”.

Tuition fee repayments raise more money from richer people

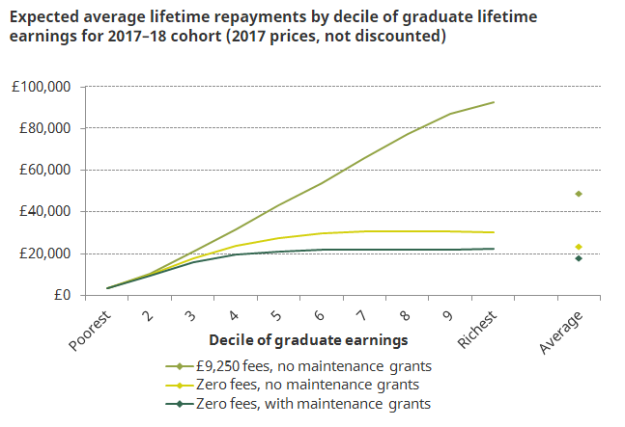
The IFS has done some modelling of tuition fees to work out how much graduates with different levels of lifetime earnings will repay. They find that higher fees mean that most people will never repay all of the money they borrow, so graduates who go on to earn more end up paying more for their tuition. Here’s a chart they published a couple of months ago comparing lifetime repayments under the current system with Labour’s proposal to scrap tuition fees and reintroduce maintenance grants:

It’s fairly clear from this chart that tuition fees are, under a certain definition of the term, progressive. People who go on to be richer pay more into the system while those who go on to earn the least pay no more than they would under Labour’s proposals. So if we define the term progressive to mean that richer people pay more then this is clearly a progressive way to raise money to fund our universities.

As a proportion of income, the richest 10% of graduates pay less than the next 40%

It’s no great surprise that rich people pay more, since repayments are proportional to earnings. In fact, the IFS notes that “for [the] majority of individuals, student loans are almost indistinguishable from an additional 9% graduate tax on their earnings” (or more precisely, their earnings above £21,000). But if we are going to think about student loan repayments as a kind of income tax then this suggests another definition of progressivity. Taxes are often called progressive if richer people pay more as a proportion of their income, not just in absolute terms. This definition sets the bar a bit higher – so do tuition fee repayments clear it?

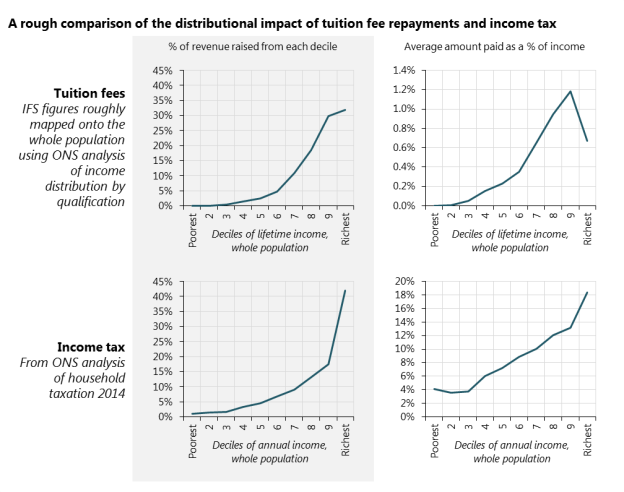
The IFS doesn’t show these figures as a proportion of lifetime income, but I was able to cobble together a rough version based on the charts in their latest briefing note on the subject. The charts below show the difference in repayments between the current system and Labour’s proposal (i.e. the distance between the top and bottom lines in the IFS chart above) in absolute terms and as a proportion of lifetime income.

Now the picture looks a bit more complicated. Student loan repayments remain progressive at lower end of the income distribution. This is because repayments aren’t taken from the first £21,000 of your income and many graduates with the lowest lifetime incomes never earn much above this threshold. However, repayments now begin to look faily regressive at the top end of the income distribution. The richest 10% of gradutes contribute a smaller share of their income than the next richest 40%. This is because if repayments are a graduate tax, they are a tax with capped lifetime repayments. Once the full loan has been paid off, you stop paying tax. A significant proportion of the top 10% of earners pay off the full loan well before the 30-year limit (when it is written off), so they pay this tax for a shorter amount of time than everyone else.

So student loan repayments are progressive at the bottom of the income distribution, but under certain definitions they are regressive at the top end. But of course, that’s not really the question we are trying to answer here. We want to know whether abolishing tuition fees would be regressive. The IFS seem to think they have answered this question with the chart above, saying that “as high-earning graduates repay the largest share of their student loans, they benefit the most from the removal of tuition fees”. This, however, is nonsense. Unless they believe that we are going to replace the funding that universities lose with money that we have conjured out of thin air, they simply haven’t done the analysis that is required to prove or disprove this claim.

There are other progressive ways to fund university tuition, such as taxes

To work out the impact of abolishing student loans we need to have an idea of what will replace them as a funding stream for universities. The answer is of course that universities will get more direct funding from government, which will in turn be funded by higher taxes now or in the future, or by reductions in other areas of government spending. If the net effect of abolishing tuition and raising whatever taxes (or cutting whatever services) will pay for it leads to rich people doing better and poor people doing worse, then it seems reasonable to call the change regressive.

There are countless different ways to increase taxes, but since we are equating loan repayments to a sort of income tax, let’s focus on that. The chart below shows how the distributional effects of tuition fees compare with income tax.

(Since the IFS charts are based on the graduate income distribution – and graduates are richer than the rest of the population – they understate the progressivity of tuition fees in the population as a whole. I have roughly mapped the figures onto the population-wide income distribution so that we can make a better comparison with income tax figures. The mapping is very approximate, so please take the numbers with a pinch of salt.)

Compared to income tax, tuition fee repayments take less money from the people right at the bottom of the income distribution. This makes intuitive sense: income tax kicks in at £11,500 but tuition fees don’t kick in until £21,000 – plus there are more non-graduates at this end of the distribution who don’t make any repayments at all. At the other end of the distribution, tuition fees also take less money from the richest. The top decile pays around 40% of all income tax, but only around 30% of tuition fee repayments. Again it’s not hard to see why: marginal tax rates increase with income under income tax but not under tuition fees; and many of the richest graduates pay off their loans early and then stop paying their 9% “tax”. The people who do worse under tuition fees are those in the top 40% of the income distribution but outside the top 10%.

So what would  be the distributional impact of abolishing tuition fees and raising the same amount of money through income tax (in a distributionally identical way to current income tax take)? Well you would take some money from the richest 10% and some more from the poorest 60% and give it to those in between. Is that progressive or regressive? Well it’s kind of both: regressive with respect to poor people and progressive with respect to the rich. Either way, it’s quite different to the IFS claim that high-earning graduates would benefit the most from the abolition of fees. If the money was raised by increasing income tax equally for everyone then the richest 10% would be the biggest losers.

Of course, there are lots of other ways to pay for scrapping tuition fees and some clearly are regressive. The tax system as a whole is less progressive than income tax and if the policy was funded by a hike in VAT, for example, poor people would end up paying much more than under the current system and rich people much less. If other areas of government spending were cut you could generate just about any distributional profile you wanted, but since a large part of government spending in the UK is targeted to low-income groups, many options would be less progressive than tuition fees. The point though is that you can’t say whether scrapping one funding stream is progressive or regressive unless you consider its replacement.

Labour’s tax proposals are more progressive than tuition fee repayments

As it happens, the Labour manifesto – in which scrapping tuition fees was the biggest spending item – set out a number of tax rises to pay for their spending commitments, including an increase in income tax. However, the Labour policy wasn’t to increase income tax equally for everyone, but to increase it for the top 5% of earners only. We don’t need to draw any more charts to see that this is a much more progressive way to raise money than tuition fee repayments: 100% of the revenue is raised from the top decile. This would only cover a bit more than half of the cost of scrapping tuition fees, but the manifesto also included promises to reverse recent cuts in inheritance tax and capital gains tax, and charge VAT on private school fees. Scrapping tuition fees and paying for it by making these sorts of changes to the tax system would mean poor people paying less and rich people paying more. It would be progressive.

In conclusion

So what have we learned from all this? Well, tuition fee repayments are a progressive source of funding for higher education, insofar as rich people pay more for the same product. The system is great for the poorest, who may not end up paying anything back at all. However, if you look at how much people pay as a proportion of their income – which is how we usually assess the progressivity of a tax – the system starts to look quite regressive at the top end of the income distribution and the richest 10% seem to do rather well.

But just because tuition fees are fairly progressive, this doesn’t mean that scrapping them is regressive. This would be true if loans were scrapped and people had to pay current tuition fees out of their own pockets, but that is not what is being proposed. If taxes are increased to pay for the change then there are plenty of ways that the net effect could be progressive – and plenty of other ways that it could be regressive. But with the sort of tax increases that Labour set out in their manifesto, it seems clear that the net effect would be to increase the overall progressivity of government activity.

Now I don’t mean to suggest that we should scrap tuition fees just because we can find a more progressive way to fund university education. Distributional effects are not the only criteria by which we need to assess policies. Moreover, unless we think that the state currently does too little redistribution, it’s not clear that we would want every policy change to be progressive – and if we do think that, shouldn’t we be rectifying it by reforming the tax and benefit system? The aim of the university system is to educate, not redistribute, and any effects on access for people from poorer backgrounds seem much more important to reducing inequalities than the direct distributional consequences of choosing between tax-based and loan-based funding. So let’s talk about whether higher levels of debt will put some groups off applying to university, or whether a move back towards tax-based funding would lead to caps on student numbers and exclude poorer applicants. Let’s ask whether scrapping fees would lead to lower per capita funding for our universities, and whether this is a good or bad thing. There are many valid arguments to be made for and against tuition fees, but the claim that scrapping them would be regressive is not one of them.

Disclaimer

The analysis in this post is very rough. I don’t have access to the IFS model so I’ve read numbers off charts in their reports, mapped graduates very approximately onto the population-wide income distribution and conflated lifetime and in-year repayments. It wouldn’t be hard for someone at the IFS to do this analysis properly – and I would argue they should have already done it if they are making claims about who benefits from scrapping tuition fees. I’m pretty sure that the results would be similar to mine, but I would be delighted to be proved wrong. The point of this post isn’t to defend scrapping tuition fees. It is to insist that before we use words like “regressive” to describe a policy, we need to do the distributional analysis properly.

The magic money tree

On Question Time this weekend, Theresa May was confronted by a nurse whose pay has been squeezed under the Coalition and Conservative governments. Her response to the nurse’s complaints was that “there isn’t a magic money tree that we can shake that suddenly provides for everything that people want”. Theresa May is of course right. There is, as far as we know, not a magic money tree. However, I fear that as an explanation for why nurses can’t have a pay rise, her statement is lacking.

That is not to say that there is no link between magic money trees and nurses’ pay. If there were indeed a magic money tree, then its harvest could surely be used to pay nurses more[1]. The absence of such a tree is a necessary condition for it being impossible to pay nurses more – but it is not sufficient. The reason for this is that there are types of money that are not magical and do not grow on trees. In failing to address the availability of this more mundane form of money, Theresa May has, not for the first time, not really answered the question.

A more charitable interpretation of Theresa May’s statement is that she is trying to argue that we can’t afford to increase government spending above current levels. Government spending is financed by taxes or debt, which must be repaid from future taxes, so the ability of a government to afford a given level of spending is dependent on its ability to raise taxes. One reason that some developing countries struggle to fund public services such as health care is that they have weak public institutions and so can’t raise taxes very effectively. The UK and most other rich countries are much better at collecting taxes and have larger public sectors. But their scope for public spending is not unlimited, for two reasons: high taxes and a large public sector might have a distortionary effect on the economy, discouraging economic activity and squeezing out the private sector; or democratic processes might limit the size of the state by voting out governments that raise taxes.

This is all very complicated and hotly disputed, but one way to understand whether the UK could conceivable have higher public spending is to look at how we compare to other countries. The chart below (based on OECD data) compares public spending as a share of GDP with GDP per capita, for all OECD countries where data is available[2].

On both measures, we are roughly in the middle. GDP per capita in the UK is about the same as Japan, France and Finland, higher than Spain and Italy, and a fair bit lower than most other Western European countries. Public spending (as a share of GDP) is lower than in most Western European Countries, but higher than Japan, Australia or the US.

It is also fairly clear that, as far as this dataset goes, there is no relationship between the two variables. Sweden, Austria and Denmark have much higher public spending than the UK, but this doesn’t stop them having much higher economic output. On the other hand, Australia and the US manage higher economic output with lower public spending. It seems that (within the range of this chart) pretty much any combination is possible. Of course, this doesn’t prove that higher taxes wouldn’t be bad for the UK economy. Perhaps our economy is so fragile that it would be crippled by any tax rises. But if you are going to argue this you are going to have to convince me that it is impossible for us to achieve what much of the rest of Western Europe can.

The political question is more difficult to analyse. Yes, other countries have larger public sectors, but they also have different political cultures. Perhaps the British are fundamentally different to our European neighbours and would simply not stand for the tax rises that are required to finance better health care and pay rises for nurses. Perhaps we are and will always remain a low tax country.

I don’t have a strong opinion on the optimal size of government, but I do wish we could have an honest debate about it. When someone says “we can’t afford it”, we need to be clear that this is nonsense. What they are really saying is that they do not think that we should raise the taxes required to pay for it. This is a debate that we need to have, but saying “we can’t afford it” is not the way to go about it.

The phrase “magic money tree” is even worse: it is designed to ridicule the suggestion that public spending should be increased. A nurse asking for a pay rise is as stupid as someone who believes that money grows on magical trees. Repeating this phrase whenever anyone suggests spending public money on something is not only nonsensical but frankly offensive.


[1] This statement is not the main point of this post and I don’t want to hear from any macro-economists about the inflationary effects of magic money trees.

[2] Excluding Ireland and Luxembourg, whose results are heavily distorted by their role as tax havens.

How not to reject a proposal

In last night’s Sky News “debate”, Theresa May was asked about social care. It was clear she had been given some new lines to try to convince the public that she hasn’t U-turned since the Conservative manifesto was published, but this is a difficult act to pull off.

The problem for the Tories is that their manifesto said that they were rejecting Andrew Dilnot’s 2011 proposals to put a cap on care costs, the Health Secretary went on Radio 4 and said that there wouldn’t be a cap on care costs, but now Theresa May is saying that there will after all be a cap on care costs. It looks on the face of it like the PM has changed her mind, but changing one’s mind is dangerously close to flip-flopping and has a whiff of weakness. So a decision has been made to try to convince us that no minds have been changed, that the current policy is what the manifesto always meant to propose and that to say otherwise is simply scare-mongering.

Here’s the most problematic passage of the manifesto for someone wishing to make this argument.

We believe this powerful combination maximises protection for pensioner households with modest assets, often invested in the family home, while remaining affordable for taxpayers. We consider it more equitable, within and across the generations, than the proposals following the Dilnot Report, which mostly benefited a small number of wealthier people.

It sounds an awful lot like the Tories are explicitly rejecting Dilnot’s proposals, which it is claimed “mostly benefited a small number of wealthier people” – a common (but inaccurate) criticism of the proposed cap on care costs.

But wait – this paragraph doesn’t explicitly say that they are rejecting the idea of a cap, just that they don’t like “the proposals following the Dilnot Report”. It is this chink of light that some bright spark in the Tory election campaign has tried to prise open with a new set of lines that hit our airwaves last night. In this version of events, it is not the idea of capping costs that has been rejected, but the version of a cap proposed by Andrew Dilnot. This has been fleshed out with two quite specific objections to the Dilnot proposals – so let’s see how they stack up.

1. It was going to be paid for out of general taxation

In some other countries, working age people pay into social insurance schemes so that they are protected against social care costs in their old age. In others, this transfer from our working life to our old age is made using general taxation. However, in both cases, the money is not really saved up. The current working age population pays in and the current population of older people takes out. If at some point coverage is significantly increased then there is a generation of people who are already retired and will take out more without paying in more. There is a widespread view in the UK that the current generation of retired people already have it too good and that it simply wouldn’t be fair to ask the working population to pay more to fund their social care. Whether you subscribe to this view or not, where the money comes from is an important issue to consider. So does the new Tory position on this represent a rejection of Dilnot’s proposals?

Here’s what the Dilnot Report said on how the reforms could be paid for.

The Commission believes that there are three possible ways for our recommendations to be paid for:

  • The Government may decide it wishes to raise additional revenue through general taxation. This is the way in which the current system is funded.
  • It may choose to reprioritise existing expenditure, because it places greater value on this than other spending.
  • It may decide to introduce a specific tax increase and, if it did so, it would make sense for this to be paid at least in part by those who are benefitting directly from the reforms. In particular, it would seem sensible for at least a part of the burden to fall on those over state pension age. If the Government decides to raise additional revenue, we believe it would be sensible to do so through an existing tax, rather than creating a new tax.

In making its decision on how to pay for reform, we believe the Government needs to consider the impact of any funding mechanisms on different income and generational groups.

This is, to say the least, quite vague. This was presumably tactical, since the previous attempt at reform was scuppered by the political fallout from proposals to fund it through inheritance tax, but some people have criticised the Dilnot Report for not making a clear proposal. What is clear, however, is that it is not accurate to say that the Dilnot reforms were going to be funded through general taxation. The decision was left to government.

When the Coalition accepted Dilnot’s proposals, they did in fact tackle this issue – and they did not choose to fund them through general taxation. Instead they stated that the reforms would be funded by changes to the state pension and inheritance tax, so that intergenerational unfairness would be minimised.

So how are the Tories now planning to fund their proposals? It’s not possible to answer this question definitively, since unlike the Dilnot and Coalition proposals, the Tories have refused to say at what level they would set the cap, let alone what the proposals would cost. But a significant proportion of the cost will be met by changing the means-testing rules so that people have to use the value of their house to pay for care even if they are still living in it. Is this the change that sets the Tory proposals apart from the Dilnot reforms?

Alas, no. It was in fact Andrew Dilnot himself that proposed this policy.

At present, housing assets are treated differently across the social care means tests (domiciliary and residential) – the result is that different care settings are not on a level playing field. Individuals who may have a preference to receive care in their own homes have a financial incentive to do so; however, local authorities have an incentive to encourage movements into residential care to increase charge revenue. In the longer term, the Government may wish to rationalise these arrangements.

We know that making such a change would be difficult. Our public research reveals that using housing assets to pay for care is a very emotive issue. However, once a cap is in place, it may be easier for people to think about such a change. Our deliberative research indicates that people may be more willing to use some of their housing assets to pay for care if they know that will not have to spend the whole amount. To support changes of this kind a universal deferred payment scheme would need to be in place.

So where does that leave us on the PM’s first claim? The Dilnot Report did not specify that the change should be paid for out of general taxation, the Coalition policy was explicitly to fund the changes in a way that targeted the older population, and the new Tory proposal to fund the changes is lifted straight from the Dilnot Report. The claim made by Theresa May last night is untrue.

2. It protected wealthier pensioners but did nothing to protect pensioners on modest incomes

The first thing to say about this claim is that it demonstrates that Theresa May doesn’t really understand Dilnot’s proposals or her own. The main focus of the debate has been the treatment of assets, not incomes. The manifesto proposal to raise the means test floor means that people who have assets of £100k or less won’t have to pay for care from their assets – but they will still have to use their incomes.

But let’s gloss over that and charitably assume that she meant people with modest assets. Did Dilnot’s proposals do anything to help them? The answer is of course yes. Dilnot recommended that the means test threshold should be extended to £100k, but that it should be tapered so that the less wealth you have the more support you get. This system is actually pretty effective at protecting people with modest assets. Here’s Dilnot’s assessment of the protection that people get from the combination of a cap on care costs and his means-test changes.

The Conservative manifesto did propose something slightly different to this. The means test would be extended to £100k – borrowed straight from Dilnot – but it would no longer be tapered, so that everyone with less than £100k in assets gets the same level of support. This is more generous that what Dilnot proposed and gives more protection to people with low levels of assets, but it is a modification rather than a rejection of the original proposals. The claim made by Theresa May last night is clearly untrue.

Despite all the lying, the U-turn policy is not bad

So we can see that, rather than rejecting Dilnot’s proposals, the Conservatives are now adopting them whole-heartedly, while going even further than Dilnot recommended on extending the means test. But they have clearly calculated that the worst possible thing would be to admit that they have changed their minds and that it is better to try to trick us into thinking that they meant this all along. In doing this they are taking the public for fools, but it may be a line they can hold until the election. However, while all the lying is not a good look, the actual policy they have ended up with is not bad – even if there is a suspicion that they ended up here by accident.

The chart below compares the impact of the policy with the previous Coalition position, which was to implement a version of the core Dilnot proposals with a £75k cap. (This chart is a little different to the one from the Dilnot Report, since I have assumed that the person has £50k in savings.)

As the chart shows the U-turn policy (with a £75k cap) is better than the Coalition policy for people with housing wealth less than £100k or so. It is worse for people with more than this (including someone who owns a median-value property) because they will pay more if they need home care, but even in the worst case scenario they will only use just over 40% of their assets paying for care. It addresses the uneven incentives between home and residential care identified by Dilnot and the additional charges paid by home care users mean that it will probably be cheap or even cost-neutral. This is a perfectly reasonable policy proposal.

But as ever, the devil is in the detail, and we have precious little of that so far. Theresa May refuses to give us any indication of where the cap will be set, preferring instead to consult on it after the election. (Presumably she is not aware that the Coalition has already consulted on this funding model.) The level at which the cap is set is important: if it is set at £75k then the maximum amount of assets that someone will use to pay for social care is around 40%, but if the cap is £150k then this goes up to 60%.

The mechanism for allowing people to use their housing wealth while they are still living in their house is also going to be crucial to the success of the policy. If, as suggested by the Tory manifesto and the Dilnot Report, local authorities are going to pay up-front costs and claim the money back from people’s estates, this means a huge expansion of their role as debt collectors. When people inevitably try to hide their assets and get away without paying, are local authorities willing and able to chase their heirs through the courts? If, on the other hand, the intention is to work with the private sector to finance care through an expansion of expensive equity release products, the political fall-out a decade down the line when financial services companies start gobbling up people’s estates could be severe.

These are difficult policy issues, but they should be surmountable. Unfortunately, the Conservative approach to social care reform to date does not inspire confidence that they have the competence and commitment to do the surmounting.

When is a cap not a cap?

Following my recent post on social care reform, I’ve had some interesting discussions about the ins and outs of different options. In this short follow-up, I want to pick up on one argument that is a bit too complicated to go through properly on Twitter: whether the proposed “cap” can really be considered a cap.

James Lloyd makes the point that in the current system, local authorities have used their market power to push down the price they pay for care. This has meant that care providers charge people who pay privately a higher price to make up for the low profit margins (or perhaps even losses) that they make in their dealings with local authorities. Some people argue that this is a stealth tax levied by local authorities to keep their social care costs down, others characterise it more innocently as “price discrimination”. Either way, if a capped cost system were to be based on the local authority price then it could underestimate what people have actually spent, leaving them spending more than £75k before reaching a £75k cap.

Others have made related points. Sonia Sodha argues that the cap isn’t a cap, because people will still have to pay for their food and accommodation if they go into a care home.

Both James and Sonia are in a sense right: there are limits to what the Dilnot proposals will cover and some people may pay more than the theoretical cap. In fact, such limits apply to any system of social protection, for social care or anything else, and what people actually get in practice is never as simple as a one-line explanation of the offer. If there is too much distance between what a system sounds like to the public and what it means in practice then it risks being unpopular, so this is something worth considering before ploughing ahead with reform.

Given that all systems suffer from this problem to some extent, we want to know whether it is significantly worse under the Dilnot proposals than under other options – and as it happens, we have quite a few options to play with. A number of different reforms to social care have been recommended over the last two decades, most of which were serious and sensible and all of which have foundered due to a lack of political will. The table below takes each of these systems and tries to articulate what it sounds like to the public and what it would mean in reality (assuming local authorities continue to pretend social care costs less than it does).

  What it sounds like to the public What it would mean in reality
Raise the means-test floor
(Tory manifesto, 2017)
You will not be left with less than £x of assets
  • You have to pay top-ups after you hit the floor so you might be left with less than £x
Capped cost model
(recommended by the Dilnot Commission, 2011)
You will not have to spend more than £x on social care
  • You pay the first £(x+ε) of your social care costs
  • After that you have to pay a small top-up
  • You will pay the part of your care home cost that is for food and accommodation
Shared cost model
(recommended by the Wanless Review, 2006)
The government will pay x% of your social care costs
  • The government will pay (x-ε)% of your social care costs
  • You will pay the part of your care home cost that is for food and accommodation
National Care Service
(recommended by the Royal Commission, 1999)
Social care is free
  • Social care is mostly free but you have to pay a small top-up
  • You will pay the part of your care home cost that is for food and accommodation
Current social care system
(since 1948)
The state will pay if you can’t afford to from your income and assets
  • The state will pay most of it, but your family might have to pay a small top-up
National Health Service
(since 1948)
Health care is free
  • An approved set of health care interventions are free
  • You have to pay the full cost if you want things outside of this set

I really struggle to see how the Dilnot proposals are very different in this regard to the other plausible options. The cap tells people they will only spend £x, but in reality they have to spend more than £x; a National Care Service tells people social care will be free, but in reality it’s not free. Under a cap people still have to pay for their food and accommodation if they go into a care home; but they will also have to do this under a shared cost model, leaving them paying much more than the stated percentage of the care home fee.

I don’t mean to argue that a disjoint between how a system is described and reality is harmless. Take the NHS: people think that it means that all health care is free and are scandalised when they are told that the NHS won’t cover the expensive new cancer treatment they have heard about. This causes upset and eats away at trust in the institution, but it is to some degree unavoidable: the NHS can’t pay for high-cost, low-value treatments unless we raise lots more in taxes, but it’s never going to be possible to explain to everyone how NICE technology appraisals work.

It is reasonable to look for a system that minimises this issue, as one of a number of criteria for assessing policy options. It is reasonable to call for local authorities to pay a realistic price for social care, or to demand that government does more to explain the limits of the policies that it proposes. However, in this case, the gap between what a policy sounds like and what it is likely to be in reality does not seem to be a significant factor in deciding between social care funding systems. While debate about the merits of different options is to be welcomed, I do think there is an obligation on those who say “the cap is not a cap” to explain how this can be addressed or how the issue would be less significant under other options for reform. Otherwise it is hard to see this issue as anything but a distraction.

The Conservative manifesto, social care and taxing inheritance

UPDATE: Some of this post is a little bit out of date, since in the time between writing and publishing, the PM appears to have done a U-turn and re-committed to the coalition policy of a cap on care costs. I’m not going to update the whole post to reflect this, since I think it’s still worth understanding the impact of the manifesto policy, but I’ve added a section at the end discussing the implications of the U-turn.

The dementia tax as an inheritance tax

The Conservatives’ new social care proposals have caused a stir. Their manifesto promises changes to the way in which state support is means-tested. People with assets less than £100,000 will now be entitled to state support – up from £23,250 – but the definition of assets has changed, so that your house is now included even if you are still living in it. Previously the house was only included if you went into a care home (and you didn’t have any family still in the house). To get around the fact that it’s difficult to sell something you are living in, people won’t have to pay up-front but the money will be claimed from their estate when they die.

The backlash has been fairly predictable, although one must wonder if the Tories underestimated it when they put this in their manifesto. The changes have been labelled a “dementia tax”, referring to the fact that people who get dementia and need support in their own home now incur much higher costs while those with other illnesses continue to get free treatment on the NHS. There are echoes of the Tory cries of “death tax” that sounded the death knell of the last-but-one attempt to reform social care: Labour’s National Care Service.

But there has been support for the policy and some of it has come from a surprising angle, given that this is a Conservative reform relating to the inheritance of wealth. Some commentators have praised the reforms as progressive because they take away some wealth that would otherwise be passed on to children, while additional protection is only provided to those with lower levels of assets. This is set in contrast to Andrew Dilnot’s proposals to cap lifetime social care costs, which offered risk-pooling to everyone, including the wealthy.

Broadly speaking these arguments are correct. The Tory proposals are progressive, in that they make small inheritances (passed on by people who need social care) a bit bigger and medium to large inheritances (passed on by people who need social care) a bit smaller. But if we want to see the dementia tax as a sort of inheritance tax then we don’t need to discuss it in the abstract. We can do some analysis to see exactly what sort of inheritance tax it would be.

Estimating the total rate of “taxation” on inheritance

If we are going to think about social care costs as a tax on inheritance then we need to consider them alongside the other major tax on inheritance: inheritance tax. As well as the changes to social care, the Tories are also cutting inheritance tax by raising the threshold at which it kicks in from £325k to £500k per person. This allowance can be passed on to a spouse, meaning that mum and dad’s estate won’t incur any tax unless it’s worth more than £1m. So what is the combined effect of these two “taxes”?

It’s easy to calculate the effective tax rate on an estate in any given scenario. For example, under Tory policy, someone starting with a £200k estate who needs expensive social care would have £100k of their estate protected and have to spend the other £100k on social care. The “dementia tax” on this person would be levied at a rate of 50%, but they wouldn’t pay any inheritance tax. Meanwhile, someone with an estate of £1.5m who never needs any social care would pay 40% inheritance tax on all assets over £1m, working out as an effective tax rate of 13%, but they wouldn’t be hit by the dementia tax.

The chart below shows how the combined tax rate relates to the value of someone’s house (assuming they also have £50k in savings) under the current system and the Tories’ proposals for social care and inheritance tax. The “dementia tax” rate also depends on how much social care someone needs, so two scenarios are shown: people who don’t need any social care; and those who have very high costs of £250k over their lifetime, which they can’t afford from their income.

There’s quite a lot going on in this chart, so I’ve marked on four changes that will see different groups passing on more or less to their children.

People who will pass on more to their children as a result of these changes

1. Non-homeowners who need social care

There is one group of people that absolutely benefits from the manifesto policy, and that is people who don’t own their own home. The increase in the means-test rules mean they won’t have to use their assets for social care unless they have more than £100k in the bank. People with very low value houses will also benefit: if someone has a house worth £50k and another £50k in the bank, they won’t have to use their assets either. In the current system they do.

2. Most homeowners who go into a care home

People who go into a care home already have to use their housing wealth to pay for care – that is, they already pay a “dementia tax”. If their costs are high enough, they will only be left with £14,250. The Tory proposals raise this to £100k, so many homeowners will be better off. Of course, this only affects people who are going to reach this limit. With £250k of lifetime care costs, you would benefit from the new limit if your total estate is less than £350k. Given that the median house price in England is £220k, this is most homeowners. Fewer people benefit in London, where the median house price in London is £435k.

But while most homeowners who go into a care home are better off under Tory proposals, it’s still not great for their chances of passing on money to their children. Someone with a median-value house who has expensive residential care is still going to see about 60% of their estate going into social care costs.

3. Rich people, unless they need social care at home

Only rich people pay inheritance tax. Assuming that the person in question has a partner who dies before them, the first £650k of their estate will not be taxed. In 2016-17, only 8% of the population paid any inheritance tax – and that was a record high. By raising the threshold to £500k for individuals and £1m for couples, the Tories are giving a tax cut of up to £140k to the heirs of wealthy people.

However, the proposed social care changes take this money back – but only for some rich people. Those who are lucky enough to not need social care are fine – they can still pass on the additional £140k. Those that go into care homes are also unaffected by the rule changes. But those who need care at home are going to find themselves paying more towards it. If they need a lot of home care, they may find that this completely cancels out the inheritance tax cut.

(In reality, people with £1m plus estates are likely to have high incomes, so may be paying most or all of the cost of home care under the current system. In this case they would be unaffected by the social care proposals and their inheritance tax cuts would be safe.)

People who will pass on less to their children as a result of these changes

4. Most homeowners who need care at home

Most people who own a home have most of their wealth tied up in it. Under the current system, this wealth is not considered as part of the means test as long as they are still living in the house. The Tories propose to change that, meaning that anyone who owns a house worth more than about £75k (assuming they also have £50k of savings) will have to pay more out of their assets for home care. This is the vast majority of homeowners.

For people with homes worth around £75-300k, there is a trade-off between coverage for different risks: they pay more for home care, but if they go into residential care they are better protected. However, for those with homes worth £300-600k it is all downside. Even with £250k of care costs they won’t hit the proposed £100k floor, so won’t benefit from that change, but if they need home care they will pay more – sometimes a lot more. Meanwhile they aren’t rich enough to pay inheritance tax in the first place, so won’t benefit from the tax cuts.

Many London homeowners fall into this category. The median house price in London is £435k. Someone with a house worth that much won’t benefit from the £100k floor even if they have £250k of care costs. If they go into a care home they will pay the same as under the current system. But if they have care at home, they will pay much more: more than 50% of their estate will go towards social care costs, compared to around 7% in the current system. Their children will need to sell their house to pay the debt.

Another group that will lose out is people who go into residential care and leave a spouse at home. The value of the house isn’t considered as part of the current means test in this scenario, but under Tory proposals it would be included, leaving people paying a lot more in care home fees.

Summarising the effect on people with different levels of assets

The chart below shows another way of looking at this. It segments the population by house value (again assuming they also have £50k of savings) and identifies which groups win from the changes (shaded green), which lose (red) and which get a mixed bag (orange).

The effect of the changes can be summarised as follows.

  • Non-homeowners (or those with very low-value homes) do better thanks to the rise in the means-test floor.
  • People who own low-middle value homes (£75-300k) get a mixed bag and see an equalisation of their risks between home and institutional care. Home care will be much more expensive for them, but their residential care costs will be limited. This group includes the median homeowner in England.
  • People who own middle-high value homes (£300-600k) lose out. They already faced a risk of losing more than half of their estate paying for residential care. Now they face the same fate if they need home care. Meanwhile, even if they spend the majority of their assets on social care, they are very unlikely to benefit from the increased means test. This group includes the median London homeowner.
  • People who own high value homes (£600k-£1.2m) get a mixed bag. If they need a lot of social care in their own home, they are going to have to use up more of their assets paying for it. If they are lucky enough not to need social care (or if they have to go into a care home) then they benefit from the inheritance tax cut.
  • Very rich people get to pass on more of their money thanks to inheritance tax cuts. Although people who are asset rich and income poor might see this gain cancelled out if they need home care, they are unlikely to be worse off than in the current system.

In short, the changes to the treatment of assets and inheritance in the Conservative manifesto help the poor and the very rich while hurting the people in the middle.

Comparing Tory policy with the Dilnot proposals

In setting out a new approach to social care funding, the Conservative manifesto also rejects the approach recommended by Andrew Dilnot and adopted by the Coalition: a cap on lifetime care costs. Dilnot recommended that the cap should be set between £35k and £50k, but the Coalition thought this was too expensive and set it at £75k.

It’s not quite fair to compare a cap on care costs with the Tory proposals since the cost isn’t going to be the same. The new proposals help some people and hurt others. It’s not clear what the net effect on government spending would be, but it is plausible that the proposals are cost-neutral. The Coalition’s version of Dilnot’s proposals costs around £1bn a year, so if we are to make a fair comparison we need to consider where this money would come from. As it happens, this is about what the inheritance tax cuts were reported to cost, so capping social care costs and cancelling these tax cuts could be roughly cost-neutral.

The chart below compares these two options: the Tory proposal versus a cap on care costs funded by cancelling the planned inheritance tax cuts.

Some people do better from the Tory proposals.

  • Non-homeowners (and those with very low value homes) pay little or nothing towards social care under the Tory proposals. Under the Dilnot proposals these people do much better than in the current system, but they still might use up to half of their assets on social care costs.
  • Rich people who don’t get sick are the big winners under Tory policy. There is a tax cut for all estates over £650k which is worth as much as £140k for estates worth more than £1m – although people who need a lot of home care might see it cancelled out.

Other people do better if we cap social care costs instead of cutting inheritance tax.

  • Almost all homeowners who need social care (with the exception of those with houses worth in excess of £1m) would be better off with a cap on care costs. People with houses worth the median house price or just above benefit most. Under Tory proposals, someone with a median-value house and £50k of savings would lose over 60% of their estate to social care costs, compared with less than 30% under Coalition policy.

Conclusions

Tory policies in relation to inheritances seem designed to benefit those with the least and those with the most. Those with low levels of assets (mostly non-homeowners) are better protected from social care costs and very rich people get a big tax cut – provided they don’t need social care. But the proposals leave the vast majority of homeowners either worse off full stop or just facing a different distribution of risk between home and residential care.

Reverting to the Coalition policy of a £75k cap and cancelling inheritance tax cuts could be roughly cost-neutral – meaning that the total amount of money coming out of the assets of older people would be the same – but the impact would be different. Non-homeowners would pay less than in the current system, but more than under Tory proposals, while the very rich would pay more inheritance tax. The beneficiaries would be the vast majority of homeowners. Under Tory proposals, the median homeowner could have up to 60% of their estate claimed after their death to pay for their social care, while the Coalition policy would limit this to less than 30%.

Update

Just before hitting publish, word has reached me that the Prime Minister may be in the process of a U-turn on this policy. Despite the Conservative manifesto explicitly rejecting the Dilnot recommendations, the PM appears to now be insisting that we must all be mistaken and that the policy was always going to include a cap on care costs. This puts Tory policy squarely in line with the Dilnot Report, which suggested that the means-test changes for home care could be a good idea if coupled with a cap.

So what would it look like if the manifesto changes to the means were combined with the Coalition’s £75k cap? In short, it looks much better for homeowners.

But if everyone is now going to pay less from their estates, where will the money come from? If the PM is indeed performing a U-turn here, she has just made a spending commitment in the billions. There is one blindingly obvious way to finance at least some of the cost – cancel the inheritance tax cuts. The chart above shows that even with the U-turn, the effective tax rate on estates from social care and inheritance tax combined is regressive: people with assets of £175k (in the chart, a home worth £125k plus £50k of savings) pay the highest rate. Funding the U-turn by cancelling inheritance tax cuts would be both progressive and intergenerationally fair. But it may be too much to ask from a Conservative Prime Minister.

In defence of universality

Writing for the Independent, Ben Chu is not happy about proposals to extend public support for social care to the asset-rich. Universality, it seems, is terribly unfair. Ben’s main complaint is that it will help a generation of asset-rich pensioners to pass on even more, exacerbating the increased importance of inheritance recently highlighted by the IFS. I get Ben’s concerns, but his argument is muddled and he ends up attacking ideas I think he should support.

Before I explain why, let’s separate two issues. Ben is right to point out that demand for social care is projected to rise and that this will cost more money. It’s actually worse than Ben lets on, since the Treasury has been slashing local government funding. Social care budgets are falling at a time when they need to be rising. This does not seem like a sustainable situation.

However, I’m not sure anyone is suggesting that the “solution to the crisis is to scrap means testing and to load more costs on to taxpayers in order to protect the inflated housing inheritances of the already well-off”. Whether more support should be provided to people who currently use their assets to pay for care is a separate question, and this is where Ben’s article misses the point.

Risk pooling

To see this, we need to address a concept that is fundamental to this question, but is entirely missing from Ben’s piece: risk-pooling. This is best illustrated by an example.

Ben tells us that one in ten older people will face costs of over £100,000 in their lifetime. For simplicity let’s imagine that out of every ten older people, one will spend a few years in a care home costing £100,000 while the other nine will die without any significant care costs.

Now take ten people who each retire with £150,000 in housing assets. Under the current system whichever of these people gets sick enough to end up in a care home will have to sell their house and spend two-thirds of the value on care home fees, while the others will not have to pay a penny. Since social care needs are unpredictable, none of them know ahead of time if they will be the unlucky one.

Now imagine another system where each of these people agrees to pay £10,000, either up-front or from their estate after death. This money will be used to pay the social care costs of whichever of them ends up in a care home. Economists usually assume that people prefer this option because they are risk averse. Indeed, this is why we buy insurance in other areas of our lives and why we pool the risk of health care costs through the NHS.

We can buy many types of insurance privately, but others are best provided publicly. Health insurance is the classic example: a set of well-known market failures mean that private health insurance works badly, so all advanced countries (except the USA) provide it primarily via the state. Social care insurance has some similar characteristics. In fact, it’s virtually impossible to buy at the moment because there are very few products on the market in the UK. So if the government can help people to pool their risks, surely this is a good thing.

This is what Andrew Dilnot’s proposals are about. In fact, he proposed a rather modest version whereby risk pooling only applies to people who have already spent tens of thousands on social care. As Ben notes, these proposals have a (fairly modest) cost.

This is all predicted to cost around £6bn to the public purse over five years. And remember: those billions of pounds would otherwise have been extracted from the property assets of pensioners.

There’s a word missing from that last sentence. The billions of pounds will be extracted from the property assets of sick pensioners. Pensioners who don’t end up in care homes won’t have anything extracted from their property assets.

Distributional consequences

Notice that in my example above there is no distributional impact. I’ve taken ten equally rich people and shared a risk between them. The total amount of money passed on as inheritance hasn’t increased, it’s just more evenly distributed. Things are a bit more complicated in reality, but it is important to remember that the Dilnot proposals are about how to structure a risk-pooling scheme, not where to get the money from to pay for it.

So when Ben says:

That’s a £28,000 boost to the inheritance of the children, ultimately courtesy of the taxpayer.

I’m not quite sure who the “taxpayer” is. If we are talking about the people that pay the most income tax, then (insofar as there is a correlation in earning between generations) we are talking about many of the same people who stand to inherit significant wealth from their parents.

But who says we have to fund this from income tax? It may be politically toxic, but if you are worried about the increasing importance of inheritance, you could argue for increasing inheritance tax. This would get you pretty close to my example above – in fact, it would be much more redistributive, as inheritance tax is only paid by the very richest. Alternatively, you might want to suggest changing the tax rules around pension lump sums. These possibilities get only a passing reference in Ben’s article.

Political constraints notwithstanding, we can get pretty much any distributional effect we want by choosing where the money comes from to pay for reform. But we really shouldn’t be trying to solve our distributional problems through the social care system. This system is there to make sure that people get the care they need and to limit the financial disadvantages they face as result of becoming sick. As a way of getting at the assets of old people it is pretty terrible. If we care about distributional effects (and we should) we would better off looking at the tax system.

Taxing wealth is hard. It’s tough to figure out how much people have when they are alive and inheritance tax is unpopular. The IFS tells us that the importance of inheritance is increasing, which is hard to see as a good thing. But – at risk of repeating myself – letting the one in ten old people who become severely dependent spend down their assets while letting the other 90% keep everything is a shoddy way of dealing with it.

An assault on universality

The arguments in Ben’s article aren’t specific to social care. The same arguments can be used to attack universality in all its forms. Ben could have made all of the same arguments against universal coverage for health costs – after all, it is mostly old people who use NHS services and mostly working age people who pay for it. Why not ask them to sell their homes to contribute the cost of their latest operation? Except I don’t think that Ben, or many other people, would make that argument.

Universality does involve governments providing services and support to people who have money. It’s not how most of the public sector works in the UK, but it is not “pro-rich” – in fact, it’s probably the opposite. Its corollary is higher taxes, so the rich pay for it, while the main beneficiaries are the people who fall just outside the criteria of means-tested systems. It is no accident that the countries that we see as the most “progressive” – such as the Nordics – have a wide range of universal benefits and high taxes. It is also arguable that means-testing is divisive, splitting people into those that pay into the state and those that take out.

Priorities – a caveat

In defending universality, I don’t mean to say that it is always better. By all means give me an argument that political limits on taxation make means-testing necessary to achieve certain distributional aims. Please, tell me that wealth taxation is so hard and inheritance such a problem that letting the sickest 10% of old people use up their assets is the lesser of two evils. I am listening.

Nor do I mean to say that universal coverage is the priority for the social care system. Cuts to budgets mean that councils are struggling to fund even the means-tested system that we have now. If we can’t even support the poorest in society then a lack of risk-pooling may not be our most pressing problem.

But if we are going to talk about universality, let’s be clear about what it means. It is not a hand-out to the rich and it is not about protecting people’s inheritances – any more than the NHS is either of those things. Coupled with a fair tax system, it is a progressive goal and one worth defending. I invite Ben to reconsider which side of the argument he is on.

Austerity and Brexit in England

Ever since the UK voted to leave the EU, there has been a steady stream of articles and analysis trying to figure out why. Clearly there is more than one answer: different people voted for Brexit for different reasons. Nonetheless there are some patterns. By analysing the vote share by local authority, the Resolution Foundation found that areas with higher employment rates, larger student populations, more people with degrees and higher social cohesion were more likely to vote remain. Areas with more old people, more homeowners and those that have only recently seen an increase in immigration were more likely to vote leave.

But one possibility has proved controversial: was austerity partly responsible? Chris Dillow thinks it’s possible. Austerity contributed to stagnant incomes, which may have increased resentment towards “elites”, and to a decline in public services which the leave campaign blamed on immigration. Chris’ thesis received a bit of stick on Twitter from Giles Wilkes and Rupert Harrison.

In one sense, they have a point. The Resolution Foundation’s analysis looked at how average incomes in different areas were related to the share of votes for leave. While the level of income was important, recent changes were not, suggesting that the income effect isn’t related to austerity. But in another way Chris might be right. Stagnating incomes may be an indirect effect of austerity, but a rather more direct effect (which is not included in the Resolution Foundation’s analysis) is the deterioration in public services.

Austerity has led to cuts in many public services, but local councils – who take out the bins, run the libraries and provide social care – have been hit particularly hard. Local government spending power[i] in England fell by nearly 15% in real terms between 2011/12 and 2015/16, but the impact wasn’t felt equally in all parts of the country. Areas that collect a lot of council tax relative to their total spending got off lightly – Surrey’s spending power fell by less than 5% in real terms – while those that rely heavily on central government grants have been hammered – Liverpool City Council’s spending power fell by nearly 23%.

Big drops in spending power mean closing libraries, fewer bin collections and cuts to social care. It seems plausible that in areas where public services have deteriorated further, the argument that immigrants are overwhelming these services – as championed by the Faragist wing of the leave campaign – may have more traction.

The chart below shows how changes in spending power in local authorities in England[ii] between 2011/12 and 2015/16 are related to the share of votes cast for leave.

Change in local government spending power (horizontal axis) versus share of votes case for leave, upper-tier local authorities in England

Change in local government spending power (horizontal axis) versus share of votes case for leave, upper-tier local authorities in England

You might look at this and think there is no clear correlation – but the distribution is far from random. It looks to me like there are two things going on: a negative correlation for most areas, plus a cluster at the bottom left that seems to behave differently. There are no prizes for guessing where most of these outliers are located: they are London boroughs.

The next chart shows the same data with inner (blue) and outer (red) London boroughs highlighted. London voted differently to the rest of the country. Inner London (and some “outer London” boroughs such as Newham) saw big cuts in local government spending, but voted overwhelmingly for remain.

Change in local government spending power (horizontal axis) versus share of votes case for leave, upper-tier local authorities in England
Blue dots are inner London boroughs, red dots outer London

Change in local government spending power (horizontal axis) versus share of votes case for leave, upper-tier local authorities in England

Not all London boroughs followed this pattern. Havering had a relatively small drop in local government spending, but voted heavily for leave. This shows the limitations of using “London boroughs” as a sociological grouping. Havering is the most easterly London borough and surrounded on three sides by Essex. It is just a half hour’s drive from Newham, but a very different place.

Just as not all of London followed a “London-like” voting pattern, not all other areas followed an “unLondon” voting pattern. If we exclude London from the chart, there are still a few stray dots hanging around in that bottom left area – areas that, like many parts of London, voted remain despite large council cuts. Again, there are no prizes for guessing where these places are: successful cities like Liverpool, Manchester, Bristol and Brighton.

Change in local government spending power (horizontal axis) versus share of votes case for leave, upper-tier local authorities in England excluding London

Change in local government spending power (horizontal axis) versus share of votes case for leave, upper-tier local authorities in England excluding London

So it seems that we can divide England up into two groups: “London-like” areas, which include most London boroughs and some other successful cities; and “unLondon”, which is everyone else. Many London-like areas have seen big cuts to local services and still voted remain. But when we look only at unLondon[iii], we see a different pattern: areas with bigger cuts to local services cast a greater proportion of votes for leave.

On the basis of this, it seems quite plausible[iv] that austerity was one of the drivers of the Brexit vote – but this effect was mediated by cuts to local services, rather than stagnating incomes.

Change in local government spending power (horizontal axis) versus share of votes case for leave, upper-tier local authorities in unLondon

Change in local government spending power (horizontal axis) versus share of votes case for leave, upper-tier local authorities in unLondon


[i] Calculating trends in council funding is tricky, because responsibilities of councils change year-to-year. When responsibilities are added, extra money might be attached to them but this doesn’t ease the pressure on other services. Luckily, the Department for Communities and Local Government publishesspending powerestimates which (for any two adjacent years) try to take account of these changes. By cumulating the year-on-year changes, and adjusting for inflation, we can get a reasonable estimate of the changes over time in funding for local services.

[ii] The data are for upper-tier authorities. For two-tier areas (the shire counties) the spending power of the districts within each county has been included to make the figures comparable with unitary authorities.

[iii] For the purposes of this analysis, only Liverpool, Manchester, Brighton and Bristol have been excluded from unLondon, since they are the most obvious outliers.

[iv] There are two important caveats here. First, to believe in this correlation, you have to believe that the London/unLondon split makes sense and isn’t just a convenient choice to generate a spurious correlation. For me, the story works, but you will make up your own mind. Second, this analysis only looks at one variable, so it’s possible that the pattern is actually driven by something else, such as difference in average incomes. The Resolution Foundation’s work deals with this problem by including a wide range of variables – but nothing on cuts to local services. I’d like to see them add this to their analysis.